All posts by mndotresearch

New Project: Protecting RICWS and DMS From Wind Damage

MnDOT recently entered into a contract with the University of Minnesota (UMN) to complete a research project to keep wind from damaging rural intersection conflict warning signs (RICWS) and other digital message signs (DMS).

The project is titled “Understanding and Mitigating the Dynamic Behavior of RICWS and DMS Under Wind Loading.” Lauren Linderman, assistant professor at UMN’s Department of Civil, Environmental and Geo-Engineering, will serve as the principal investigator. Jihshya Lin of MnDOT will serve as technical liaison.

“This project will find out the behavior of the DMS and RICWS under AASHTO defined design loads and develop the retrofitting system to avoid the experienced problems that will improve the public safety, reduce the maintenance cost and minimize impact to the traffic,” Lin said.

Background

RICWS have exhibited excessive swaying under wind loads, leading to safety concerns regarding failure of the support structure at the base. It is believed the heavy weight of these signs has brought the frequency range of these systems too close to that of the wind excitations. There is a need to investigate the wind-induced dynamic effects on these sign structures and to propose modifications to the systems to reduce the likelihood of failure. There is also interest in investigating the dynamic behavior of the DMS, particularly the loads on the friction connection.

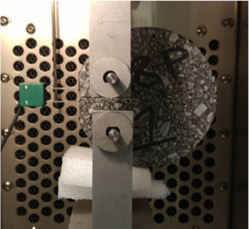
This research project involves a field investigation to determine the structural performance of these two types of sign structures. Laboratory tests using a towing tank facility and a wind tunnel will be performed on scaled models and opportunely modified models to improve performance and minimize unsteady loads.

The outcome of this project is expected to develop an understanding of the RICWS and DMS sign structures and to provide modifications to improve the structural performance of the RICWS sign structures while maintaining the crashworthy requirements. The results will help to ensure the uninterrupted service of these sign structures, which are important to public safety.


Project Tasks

  • Task 1A: Development of Field Instrumentation Plan and Instrumentation Purchase
  • Task 1B: Experimental Determination of Load Effects and Dynamic Characteristics of Post Mounted DMS in Field
  • Task 2A: Development of Numerical Models to Investigate Post Mounted DMS Sign Demands and Fatigue
  • Task 2B: Validation of Numerical Models to Investigate Post Mounted DMS Sign Demands and Fatigue
  • Task 3A: Investigation of Design Loads and Relevant Fatigue Considerations for DMS
  • Task 3B: Analysis of Design Loads and Anticipated Fatigue Life of DMS
  • Task 4: Experimental Determination of Dynamic Characteristics of RICWS in Field
  • Task 5: Development and Validation of Numerical Models to Investigate RICWS Signs
  • Task 6: Numerical and Experimental Investigation of Drag and Vortex Shedding Characteristics of RICWS Signs Using Scaled Models
  • Task 7: Numerical and Small-Scale Experimental Investigation of Modifications to RICWS Sign Panel to Reduce Effects of Vortex Shedding
  • Task 8: Numerical and Analytical Investigation of Noncommercial Means to Damp Motion of RICWS Blankout Sign Structure
  • Task 9A: Research Benefits and Implementation Steps Initial Memorandum
  • Task 9B: Research Benefits and Develop Implementation Steps
  • Task 10: Compile Report, Technical Advisory Panel Review and Revisions
  • Task 11: Editorial Review and Publication of Final Report

The project is scheduled to be completed in March 2019.

Reducing Driver Errors at Two-Lane Roundabouts

Researchers studied driving behavior at four multilane roundabouts to better understand the relationship between traffic control designs and driver errors. Data collected showed that certain traffic control changes decreased turn violations but failed to eliminate yield violations. Researchers were unable to identify long-term solutions for improving roundabout design and signage, and recommended further research to improve the overall safety and mobility of multilane roundabouts.

“Even though the study did not provide a silver bullet on how to prevent crashes at multilane roundabouts, it did create an efficient tool to analyze and quantify driving behavior data,” said Joe Gustafson, Traffic Engineer, Washington County Public Works.

“This study has advanced our knowledge in multilane roundabout safety and is one step closer to providing much needed improvements to roundabout design guidance,” said John Hourdos, Director, Minnesota Traffic Observatory, University of Minnesota.

What Was the Need?

Roundabouts have been shown to improve overall in-tersection safety compared to traditional traffic signals. However, noninjury crashes are sometimes more frequent on multilane roundabouts than on single-lane roundabouts due in part to driver confusion. Common driver errors such as failing to yield and turning violations on multilane roundabouts have contributed to an increase in noninjury crashes.

Given the benefits of improved mobility, traffic throughput and injury reduction of multilane roundabouts, reducing the noninjury crash rate at multilane roundabouts is important to facilitating their use by Minnesota cities and counties. Identifying solutions to reduce common driving violations would be more sustainable than the current practice of converting multilane roundabouts back to single-lane roundabouts.

In a previous study on a two-lane roundabout in Richfield, Minnesota, researchers demonstrated that traffic control  changes could reduce some of these driver errors. However, more data was needed to support study results. Understanding driver behavior and improving traffic control devices are key factors in designing safer multilane roundabouts.

What Was Our Goal?

With limited research on modern multilane roundabouts, the Minnesota Traffic Observatory sought to collect more data to evaluate the correlation between traffic control design features and collisions. Instead of conducting manual observations, researchers used an innovative video analysis tool to collect and process recorded videos of driving behaviors at test sites. Based on the analysis, they attempted to identify driver behaviors and error rates to help reduce noninjury crashes at multilane roundabouts.

What Did We Do?

The research team selected four multilane roundabouts in Minnesota — two in Mankato, one in Lakeville and one in St. Cloud — to observe undesirable driving maneuvers. At each roundabout site, researchers mounted video cameras at key locations to record one to two weeks of driving behavior. Only one roundabout could be observed at a time because only one set of specialized video equipment was available.

The raw videos were processed to produce a data set for analysis. Researchers used TrafficIntelligence, an open-source computer vision program, to automate extraction of vehicle trajectories from the raw footages. They used the same software to correct any errors to improve data reliability. The resulting clean data from the recorded videos were supplemented with historical crash frequency data reports obtained from the Minnesota Department of Public Safety. Collectively, data from both sources allowed researchers to thoroughly investigate the frequency and crash types from the four roundabouts. A statistical analysis of the data revealed that turn violations and yield violations were among the most common driving errors.

Researchers also looked at how violation rates vary with the roundabout’s location and relevant design features. Based on these findings, researchers proposed signage and striping changes to reduce driver errors at the two Mankato test sites. After the changes were implemented, they collected additional video data.

What Did We Learn?

This study provided one of the most comprehensive analyses to date of driving behavior at multilane roundabouts. Researchers were successful in finding solutions for reducing turn violations, but they were unable to identify solutions for yield violations despite the vast amount of data.

Minor differences in the design at each roundabout presented specific challenges. The analysis focused on how each varying design feature impacted driving behavior. Proposed traffic control changes such as extending solid lines between entrance lanes, adjusting the position of yield signs and adding one-way signs successfully decreased turn violations. However, data from before and after traffic control changes showed an insignificant impact on decreasing yield violations. Importantly, the study produced a list of ineffective traffic control methods that can be eliminated from future studies, saving engineers time and money.

The TrafficIntelligence tool was crucial in efficiently processing and cleaning large amounts of raw video. With improvements made to the software program, the tool should be an asset to future research on roundabouts and to other studies requiring observations of driving behavior.

What’s Next?

The traffic control changes that were successful at reducing crashes at two-lane roundabouts should be implemented by traffic engineers. In particular, large overhead directional signs or extended solid lines between entrance lanes should be installed to help reduce turning violations. The analysis method used in this study could also be used for a robust before-and-after evaluation of future modifications to traffic control devices.

Additional research could further scrutinize the data already collected, and researchers recommend that more data be collected to examine additional traffic control methods and other intersection design elements to improve the overall safety and mobility of two-lane roundabouts. This research could also serve as an impetus for the study of numerous roundabouts in a pooled fund effort involving several states.


This post pertains to the LRRB-produced Report 2017-30, “Evaluation of Safety and Mobility of Two-Lane Roundabouts,” published July 2017. A webinar recording of the report is also available.

MnDOT Chooses EasyMile for Autonomous Shuttle Bus Project

ST. PAUL, Minn. – The Minnesota Department of Transportation chose EasyMile, a France-based company specializing in driverless technology, to lead its autonomous shuttle bus pilot project. MnDOT announced in June it will begin testing the use of an autonomous shuttle bus in a cold weather climate.

“We’re excited to partner with EasyMile to help MnDOT test autonomous technology,” said Jay Hietpas, MnDOT state traffic engineer and project manager. “Their expertise will help us learn how these vehicles operate in a winter weather environment so we can advance this technology and position MnDOT and Minnesota as a leader.”

EasyMile, which has a location in Colorado, has conducted driverless technology cold weather tests in Finland and Norway. Minnesota will be their first cold weather test site in the U.S. EasyMile will use its EZ10 electric shuttle bus that has already transported 160,000 people more than 60,000 miles in 14 countries. The shuttle was tested in various environments and traffic conditions. During these tests, the shuttle operated crash-free.

The shuttle operates autonomously at low speeds on pre-mapped routes. It can transport between six and 12 people.

Initially, it will be tested at MnROAD, which is MnDOT’s pavement test facility. Testing will include how the shuttle operates in snow and ice conditions, at low temperatures and on roads where salt is used.

Testing is scheduled to start in November and go through February 2018. The shuttle will also be showcased during the week of the 2018 Super Bowl.

Hietpas said 3M will also be a partner in the project so the company can research various connected vehicle concepts including sensor enhancement and advanced roadway safety materials. When optimized, these materials would aid in safe human and machine road navigation.


Read more about the autonomous shuttle bus pilot project:


Related MnDOT research:

New Procedures Offer Guidance for Using Bonded Whitetopping on Asphalt Pavements

Researchers developed procedures for selecting asphalt pavements for thin whitetopping based on site examination and lab testing. Test results do not offer definitive indications of how overlaid asphalts will perform, but procedures offer recommendations on pre-overlay pavement treatment, testing protocols and design considerations for bonded concrete overlay of asphalt.

“This research established a procedure for testing pavement cores. However, more performance data on whitetopping is needed to correlate pavement performance and asphalt properties,” said Tim Andersen, Pavement Design Engineer, MnDOT Office of Materials and Road Research.

“These procedures address collecting field data and testing pavement core samples in the lab. They also provide useful guidance for pavement repair and design considerations for overlays,” said Dale Harrington, Principal Engineer, Snyder and Associates, Inc.

A badly rutted pavement.
Rutted and otherwise damaged asphalt pavement is a candidate for a bonded concrete overlay that can mitigate damage under the right site conditions.

What Was the Need?

Many counties throughout Minnesota have used bonded concrete overlays to rehabilitate asphalt pavement. Though not widely used by MnDOT, a bonded concrete overlay, or whitetopping, normally involves milling a few inches of asphalt off the damaged surface and placing 4 to 6 inches of concrete over the asphalt pavement. A well-bonded overlay can add 20 years to a pavement’s service life.

Bonded whitetopping performance has not been care-fully tracked, and correlation of its performance with the underlying pavement condition is not well understood. Be-fore MnDOT can expand its use of bonded whitetopping, materials engineers wanted to better understand what asphalt pavement conditions are best suited to this type of overlay, how asphalt behavior influences the concrete top layer and what underlying pavement characteristics affect the expected lifetime and performance of bonded white-topping.

What Was Our Goal?

This project sought to develop an integrated selection procedure for analyzing existing, distressed asphalt pavement to identify good candidates for bonded whitetopping and establish design considerations for a site-specific, effective concrete overlay. By testing pavement core samples in the lab, investigators wanted to identify asphalt pavement properties that correlate with distresses in concrete overlays that are 6 inches or less. They also sought specific recommendations for managing trans-verse cracking in asphalt to avoid reflective cracking into concrete overlays.

What Did We Do?

Researchers began with a literature review of approaches to selecting pavements for bonded whitetopping. The results of this review were used to develop testing procedures to identify the volumetric properties of existing asphalt pavements. Researchers applied these procedures to 22 pavement cores from six concrete overlay sites in Iowa, Michigan, Minnesota and Missouri. Selected projects entailed 4-inch to 6-inch overlays in fair to good condition that were built from 1994 through 2009. Data about mix design, asphalt condition, pavement thickness, overlay thickness, site conditions and other details were available for each site.

The research team compared roadway data with falling weight deflectometer measurements from pavement cores to evaluate field performance and design recommendations suggested by the selection procedure. To refine the procedures, investigators evaluated volumetric asphalt characteristics for their potential influence on premature overlay cracking due to stripping, slab migration and reflective cracking. Finally, the team developed a detailed selection process that includes steps to identify and test asphalt pavements with potential for bonded whitetopping, repair asphalt before overlays and establish design considerations for overlays based on the test results from the selected asphalt pavement.

What Did We Learn?

The selection procedure, which is based on recommended practices from the National Concrete Pavement Technology Center, has six steps:

  • Perform a desk review of available site data, including design, repair and environmental conditions.
  • Obtain pavement core samples.
  • Conduct site visits to examine existing conditions.
  • Obtain additional core samples for testing, when necessary.
  • Prepare preliminary cost and materials estimates, if practical.
  • Provide design recommendations.

Investigators tested pavement cores for air voids, density, stiffness, fatigue, aging, strip-ping potential and other distress parameters. Results were inconclusive in terms of identifying asphalt properties that lead to specific bonded concrete overlay failures or to long-term performance of bonded whitetopping projects. The pavement cores showed wide variation in material properties, but few of these distresses. Researchers framed the recommendations for testing volumetric properties in the format of MnDOT’s Pavement Design Manual, giving the agency an easily adoptable core testing protocol.

The selection procedures include information about the impact of transverse cracking, rutting, longitudinal cracking and other distresses on concrete overlays, and provide recommendations for treating various distresses before whitetopping. Design considerations for whitetopping are also provided based on site conditions and the results of core, ground penetrating radar and falling weight deflectometer testing.

What’s Next?

Tested overlay sections should be evaluated over time to determine if life expectancy is met or if asphalt stripping, slab migration or reflective cracking has decreased overlay life. Because volumetric tests failed to provide conclusive relationships between asphalt properties and overlay distress, further research is needed to identify mechanistic or field tests that could correlate asphalt properties with concrete overlay performance. Once this additional research is completed, the selection procedures identified could be refined and placed in the design guide. A life-cycle cost analysis of overlays would also be useful for decision-makers considering bonded concrete overlays of asphalt.


This Technical Summary pertains to Report 2017-24, “MnDOT Thin Whitetopping Selection Procedures,” published June 2017. 

Research Confirms Low-Binder Asphalt Pavement Mixtures Prone to Cracking

Disk-shaped compact tension test
The disk-shaped compact tension test determines fracture energy of pavement samples, a strong predictor of cracking performance.

Research showed that lower asphalt binder mixtures are susceptible to premature cracking. The current use of coarse-graded mix designs should be adjusted to narrow the gradation difference between larger and smaller aggregates in the mixes. While the research suggests such mixes should be used sparingly in Minnesota, it did not provide definitive data suggesting the practice should be stopped altogether. The practice may continue on a limited basis.

What Was the Need?

Introduced in 1993, Superpave has successfully helped transportation agencies in northern regions design asphalt pavements that are less susceptible to thermal cracking. When tested, Superpave-compliant designs were found to resist both rutting and thermal cracking.

Gradation-based design approaches have also allowed for the use of coarse-graded, low asphalt binder mixtures. These mix designs establish a maximum aggregate size and reduce the range of usable gradations. Such coarse-graded designs meet MnDOT specifications because the maximum aggregate size falls within the acceptable gradation range. However, the reduced fine aggregate content made possible by the use of coarse aggregates leads to a mix that, while still within specifications, offers less surface area to be coated by the asphalt binder and can encourage unwelcome permeability in the field. To win low-bid competitions, contractors have embraced these low-binder, coarse-graded designs to reduce binder and aggregate costs.

Transportation engineers noticed that these pavements seemed to “gray out” or lose their dark color more quickly than previous asphalt designs. These pavements also seemed to grow somewhat more brittle and were less able to rebound from loading. Such asphalts are thought to be prone to quicker failure than mixes with finer aggregate and more binder. Road designers typically attribute thermal cracking and potholing in low-binder asphalt to the increased permeability that leads to water incursion and freeze-thaw damage.

What Was Our Goal?

The goal of this project was to determine how well low-binder asphalt pavements per-form and whether current designs make sense in terms of cost–benefit and durability. Researchers would identify any relationship between reduced bitumen use and potential for cracking, and would suggest changes to specifications for coarse-graded asphalt pavement mixtures to prevent such cracking issues.

What Did We Do?

Researchers worked with MnDOT to identify 10 pavement locations in Minnesota that used 13 coarse-graded, low-binder asphalt mix designs. Investigators extracted data on cracking, roughness and other factors for these sites from MnDOT’s pavement management system. The research team then visited the sites and inspected the pavements.

Researchers developed a coring plan, and field samples were cored for volumetric analysis to determine the binder, aggregate, air void level and other properties of each mixture. They also tested permeability and dynamic modulus, and conducted fracture energy testing to determine cracking resistance.

Investigators used performance modeling to analyze the test results of pavement proper-ties and project pavement durability. Then they compared the projected performance to actual field performance. From this assessment, they drew recommendations for modifying specifications for MnDOT low-binder, coarse-graded asphalt mixtures.

What Did We Learn?

This study suggests MnDOT should reduce its use of coarse-graded asphalt mixtures, but the findings did not provide sufficient data to justify prohibiting the use of coarse- graded, low-binder asphalt designs.

Low-binder mixtures were prone to thermal and transverse cracking. Their high permeability left them vulnerable to premature moisture and freeze-thaw damage. Field and laboratory testing and modeling demonstrated that coarser mixtures produce excessive cracking in a short period of time. Thin overlays of 3 inches or less crack more quickly than thick overlays of 4 to 6 inches. Mechanistic-empirical simulations showed that low-binder asphalt mixtures were significantly inferior to higher-binder mixtures in terms of thermal cracking.

Most of the high-cracking mixtures showed low fracture energy in testing, suggesting the value of fracture energy testing and modeling. Disk-shaped compact tension testing showed that higher permeability mixtures correlate reasonably well with lower fracture energy. Eight of the 13 mixtures were more permeable than recommended, and six significantly so. Typical volumetric properties poorly predicted cracking.

To better project pavement performance, researchers recommend that MnDOT maintain volumetric testing-based specifications, but add performance testing-based specifications and testing designs for fracture energy, fracture resistance, modulus and other parameters. For Superpave designs, investigators suggest using a narrower aggregate gradation range, reducing the gradation gap between minimum and maximum aggregates in mixes.

What’s Next?

Although the research validates MnDOT engineers’ anecdotal concerns, the pavements evaluated were mostly overlays, which are known to be susceptible to transverse cracking because of flaws in underlying pavement layers. MnDOT may weigh the results and adjust specifications, but would likely require further study of coarse-graded mixture performance before ruling out its use or identifying situations in which coarse-graded mixtures may be the best option. Additional research could consider the use of nonuniform lift designs for asphalt pavements, varying mixes for each lift in the structure rather than using a single, uniform mix for every layer in the full depth of the pavement.


This post pertains to Report 2017-27, “Impact of Low Asphalt Binder for Coarse HMA Mixes,” published June 2017. 

Field Guide Helps Local Engineers Stabilize Damaged Slopes

Cover of Slope Stabilization Guide for Minnesota Local Government Engineers
The new guidebook provides eight cost‐effective stabilization techniques that local government engineers can undertake to stabilize slopes using local materials and equipment. 

Researchers identified 14 sites representing destabilized roadway slopes in Minnesota. Following site investigations, lab testing and modeling, researchers recommended eight slope stabilization techniques that local engineers can undertake without the help of outside geotechnical engineers. The methods were packaged in a simple, accessible field guide for county engineers.

“When most studies end, further research is needed. This project, however, created a user guide that local engineers can use right away to repair destabilized slopes,” said Blake Nelson, Geotechnologies Engineer, MnDOT Office of Materials and Road Research.

“This guide includes an easy-to-use flowchart that steers local engineers toward an appropriate slope stabilization technique,” said David Saftner, Assistant Professor, University of Minnesota Duluth Department of Civil Engineering.

What Was the Need?

Winter weather and spring storms leave their mark on slopes along highways and at bridges. Erosion and other forces cut gashes and ravines into slopes. Some damage such as failing pavement at shoulders or sloughed off sections of a slope can be obvious to road users. Other, more subtle signs of creeping embankments may only catch the attention of engineers.

Slope failures must be repaired to prevent damage to roadways and embankments. When slope damage is severe, a geotechnical engineering firm must step in at some expense. By the time the first soil sample bore is pulled, county engineering departments may already be facing a bill of $20,000. But when damage is less severe, the county can often stabilize the slope using local materials and simple techniques.

Determining whether slope damage can be completed by local engineers or requires outside help remains a challenge for county road departments that often lack geotechnical expertise.

What Was Our Goal?

The Local Road Research Board (LRRB) funded a research project to determine effective methods for stabilizing damaged roadway slopes. These methods would be incorporated in a guide that local engineers could use to identify the type of slope failure and then select an appropriate repair method.

What Did We Do?

Investigators began by surveying Minnesota county engineering departments to identify sites that needed to be stabilized. Local engineers also provided details about both successful and unsuccessful stabilization methods that have been tried in the past. The re-search team inspected 14 destabilized sites identified in this effort and took soil samples from each site.

Then they conducted a literature review of slope stabilization methods, identifying 12 stabilization techniques. Based on this review, researchers tested the soil samples with direct shear tests to identify shear strength parameters such as effective friction angle and cohesion. They ran soil classification tests to measure plasticity, granularity and gradation, and moisture content. These properties were then used as inputs in slope modeling and parametric studies to examine viable repair techniques for each site.

Investigators summarized their analysis of each case and documented stabilization methods that would meet the needs identified in the case studies. Finally, the research team prepared a slope stabilization guide that local engineers could use in the field to identify the type of slope failure and the appropriate solution.

What Did We Learn?

Five of the destabilized sites featured primarily sandy soil, eight had fine-grained soil, and one was rocky. Slope failure was visible at nine of the sites. Groundwater management figured prominently in most sites and repairs.

The literature search identified approaches for specific types of failures. Managing groundwater and drainage improves shear strength in slide-prone areas; surface covers protect slopes from erosion; vegetation and plant roots stabilize soil; excavation and regrading reduce failure forces; and structural reinforcement features directly support slope materials.

Investigators identified eight slope failure mechanisms that encompassed the full range of destabilization scenarios presented in the case studies. Each method had been identified in survey responses as a technique used successfully at the local level. The site conditions that contributed to the failure were identified along with a repair solution for each failure type.

Using the findings from this project, researchers created a slope stabilization guide for Minnesota local government engineers. This field guide describes common slope failures and conditions that may contribute to each. It includes a simple, three-step flowchart that guides engineers to the appropriate repair technique by determining whether the damage is a creep or rotational failure, whether the soil is cohesive or granular, and if there are groundwater concerns.

Based on engineers’ answers, the flowchart directs them to one or more of the eight slope stabilization techniques, providing photographs and repair methods that have been successful in addressing slope problems along Minnesota roadways.

What’s Next?

The Slope Stabilization Guide for Minnesota Local Government Engineers will be sent to each of the 87 county engineering departments. Local engineers can keep the guide on hand when they investigate slope failures along their roadways, and with it quickly identify what work needs to be done to repair the damage.

This project dovetails with two ongoing MnDOT research efforts, Slope Failure Risk Analysis and MnDOT Slope Vulnerability Assessments.

For more related research, see the Protecting Roads From Flood Damage page on the MnDOT Research Services website.


This post pertains to the LRRB-produced Report 2017-17, “Slope Stabilization and Repair Solutions for Local Government Engineers,” and Report 2017-17G, “Slope Stabilization Guide for Minnesota Local Government Engineers,” both published June 2017. 

Using Smartphones to Deliver Effective In-Vehicle Work Zone Messages

Under simulated conditions, drivers were not distracted by controlled work zone-related messages delivered through smartphones. In fact, driving performance improved. Researchers also learned that the location of the smartphone did not affect the driver if the message included an auditory component.

“The main goal was to determine whether in-vehicle warnings conveyed through smartphones would be distracting to the driver. We found that wasn’t the case,” said Ken Johnson, Work Zone, Pavement Marking and Traffic Devices Engineer, MnDOT Office of Traffic, Safety and Technology.

“We learned that drivers had a lower mental workload when they experienced the in-vehicle messages. It really didn’t matter what modality we used. Half the messages were auditory only, and half were auditory paired with visual,” said Nichole Morris, Director, University of Minnesota HumanFIRST Laboratory.

What Was the Need?

Highway work zones require drivers to reduce speed and be aware of work crews, lane closures, traffic backups, construction equipment and other potential hazards on the roadway.

Transportation departments have long employed stationary warning signs, sometimes supplemented by portable changeable message signs (PCMSs), to alert drivers to upcoming construction projects. However, some previous studies have indicated that stationary warning signs are not always effective. In addition, PCMSs are costly and may be difficult to deploy in the field.

Smartphone technology offers an opportunity to deliver accurate and early in-vehicle warnings about road construction miles ahead. Digital messages could alert drivers about upcoming work zone conditions and improve safety for drivers and workers in the field.

But receiving in-vehicle messages about work zone conditions could distract drivers from safely operating their vehicles. MnDOT needed to study the advantages and disadvantages of using smart-phones to deliver in-vehicle work zone messages.

What Was Our Goal?

The primary goal of this project was to determine whether smartphones have the potential to safely deliver effective and accurate messages to drivers about upcoming road construction on Minnesota highways.

What Did We Do?

A 7-inch LCD screen
A smartphone was replicated through installation of an LCD screen positioned inside the driving simulator.

The research team developed and conducted an online survey that focused on Minnesota drivers’ perceptions of work zone safety and on their attitudes toward using smartphones and potentially receiving in-vehicle messages regarding work zone conditions.

Data from the surveys was used by the HumanFIRST Laboratory at the University of Minnesota to develop a driving simulation study designed to determine whether in-vehicle messages sent by smartphones could promote safe driving in work zones. The study analyzed 48 drivers operating a driving simulator within two work zones to test reactions to in-vehicle messages as compared to messages displayed on an external PCMS system. Researchers collected data about each participant’s visual attention, driving performance, mental workload and opinions on smartphone technology.

Researchers also reviewed previous national studies and published works to identify environmental and driver behavior risk factors related to work zones.

What Did We Learn?

An analysis of the simulation results showed drivers were very responsive to receiving in-vehicle messages regarding work zones and roadway hazards. Messages presented through smartphones did not cause driver distractions. In fact, some drivers’ performance actually improved following delivery of audiovisual messages.

Drivers preferred to receive audio messages, and researchers learned that a synthesized female voice (like Apple’s Siri) resulted in greater awareness and acceptance from the driver than a more natural or prerecorded voice.

Survey findings showed that only 5 percent of participants use a dashboard mount for their smartphones, while the vast majority keep their phone in the cup holder, on the console, in a backpack or purse, or on the passenger seat. A few participants said they hold their smartphone while driving. Investigating the safety impact of this behavior paired with an in-vehicle messaging system, researchers found that the location of the smartphone within the simulator (on the dash or passenger seat) did not negatively impact driver safety or performance, providing the work zone message contained the auditory component.

In-vehicle messages required less cognitive effort from drivers, and drivers had greater recall of the hazard warning message versus stationary PCMS signage.

A significant number of survey participants, nearly 20 percent, provided unprompted feedback that it was the state’s responsibility to provide factual work zone messaging information and to ensure in-vehicle technology employed does not pose a distraction.

What’s Next?

MnDOT will need to continue research into the viability of smartphones as the way to deliver in-vehicle work zone messages. The simulation study provided the findings needed to advance the project to field testing, where drivers would respond to in-vehicle messages from smartphones on a test track or under real roadway conditions. Another potential topic to explore through further research is the viability of messages delivered through electronic interface or dashboard features offered on some newer vehicles.

MnDOT should identify the medium needed to deliver in-vehicle messages and use the prescribed syntax outlined by the study for communicating messages. Researchers noted the existing 511 service provided by MnDOT currently provides road, traffic, weather and other information. A study should be undertaken to determine whether the 511 or a third-party app would be most appropriate for a future statewide in-vehicle messaging program.


This post pertains to Report 2017-19, “In-Vehicle Work Zone Messages,” published June 2017.

Guidebook Reviews Enhanced Inspection Technologies for Culvert Repair

Enhanced Culvert Inspections - Best Practices Guidebook
The Enhanced Culvert Inspections – Best Practices Guidebook details various culvert inspection methods, including sophisticated technologies such as laser ring scanners and sonar scanners.

MnDOT has developed a guide that compares traditional and enhanced culvert inspection methods and tools, their limitations and costs. The guide also includes best practices for identifying when conventional inspection methods work best  and when enhanced technologies may offer good value.

“We wanted to document how far you can see into the pipe to get a good inspection and when more than an end-of-pipe inspection was needed. We found that there are some cost-effective options for doing more than end-of-pipe inspections,” said Andrea Hendrickson, State Hydraulic Engineer, MnDOT Office of Bridges and Structures.

“Inspection crews need to understand what type of data they want to gather for each situation, and then balance the quality of data required with the cost of the inspection method,” Doug Youngblood, Environmental Engineer, CDM Smith.

What Was the Need?

MnDOT manages more than 100,000 culverts in the state’s highway culvert system. Culverts are inspected routinely to monitor corrosion and other damage that could lead to expensive repairs and highway closures.

New culverts are inspected to confirm that construction measures up to specification. Centerline culverts, which run from one side of the road to the other under pavement, must be inspected every two to six years. MnDOT also inspects culverts in emergencies or when the public notifies the agency of potential damage or blockage.

Inspection typically begins with an end-of-pipe visual investigation, usually aided by flashlight or occasionally by a camera placed in the pipe. If pipes are large enough, inspectors enter the pipe to examine the walls and measure corrosion or other damage, take photos and conduct hands-on examinations.

But not all culverts are large enough for human access, and inspecting damaged or failing culverts can be dangerous. New, enhanced technologies may offer valuable, safer inspection options.

What Was Our Goal?

This project aimed to review common inspection technologies available for culvert and pipe inspection. The results of this review would then be used to develop guidance for choosing a cost-effective inspection strategy that was appropriate for the site and would provide the required data.

What Did We Do?

The research team began by reviewing literature related to culvert inspection best practices. The team then interviewed inspectors from various Minnesota counties and MnDOT districts, and from five other state transportation agencies to gather additional information on best practices.

Laser ring profiler
Laser ring profilers offer precise readings of how much culverts have reshaped under environmental conditions.

Next, investigators reviewed 12 videos of MnDOT inspections performed from 2011 through 2016 and then contracted with a robotics inspection firm to conduct end-of-pipe, laser ring and video inspections of 10 MnDOT culverts that represented a range of sizes, pipe materials and on-site conditions. The results from the three inspection methods were compared to identify best practices, which were incorporated along with the best practices from the literature review and interviews in the Enhanced Culvert Inspections— Best Practices Guidebook.

What Did We Learn?

The guide describes traditional and enhanced inspection technologies and methods, their limitations, costs and best uses for specific situations. Each method offers distinct advantages and disadvantages. End-of-pipe inspection costs about 7 cents per foot, and enhanced inspections cost from 23 cents to $6.50 per foot. Before using enhanced methods, inspectors should have a firm grasp on the quality of data and detail required to best optimize their choices and budget limitations.

End-of-pipe inspections are the fastest and least costly of the methods, but provide the least data. Typically, an inspector with a flashlight can investigate from 5 to 30 feet inside the culvert from the end of the pipe. These inspections work well for determining work conditions and data needs.

Measurement-based inspections include traditional and enhanced methods, including person-entry inspections, hammer sound testing and coring, mandrels and multiple- sensor units such as laser and sonar profilometers. Laser ring scanning offers precise measurement and excellent quantitative data on culvert alignment and geometry. Multiple-sensor units are the most expensive inspection method based on cost per foot and time to process the data, which often takes weeks.

Video inspection typically entails the use of closed-circuit television (CCTV) cameras or consumer-level video from a Hydraulic Inspection Vehicle Explorer (HIVE). MnDOT owns several of both units, which incur labor costs of about 23 cents per foot. CCTV is a national standard for inspection. It offers permanent records with familiar technology; however, lighting, image centering, lens clarity, cumbersome data volumes, and opera-tor training and experience present challenges.

The HIVE is a remotely operated crawler equipped with off-the-shelf cameras and accessories. Developed by MnDOT District 6, the HIVE takes lights and a video camera that is capable of panning and tilting inside a culvert and transmits data wirelessly to a tablet computer. While CCTV offers better measurement ability, a HIVE is lighter, easier to transport and easier to operate. Given that contractor-run CCTV typically costs $2 per foot, the cost of using 750 feet of CCTV would pay for a HIVE.

What’s Next?

In addition to the guidebook, researchers have developed a webinar on culvert inspection options for Minnesota inspectors and crews.

MnDOT will monitor developments among local contractors, as no Minnesota firms currently offer multiple-sensor inspection capability. MnDOT owns a sonar scanner for use on tripods and floatable platforms, and also owns a laser ring inspection unit. Pilot testing and training may make these options cost-effective. Researchers recommend further development of the MnDOT-developed HIVE, including a foam floating platform and a snap-on laser ring scanner for the camera.


This post pertains to Report 2017-16, “Enhanced Culvert Inspections — Best Practices Guidebook,” published in June 2017. 

Do Lower Cost Improvements to Address Congestion Lead to More Crashes?

An analysis of crash data revealed that congestion-related improvements implemented on I-35W in the Twin Cities did not introduce additional safety risks. When installed strategically, improvements like priced dynamic shoulder lanes can alleviate congestion and improve safety for motorists.

“Rather than just conducting a before-and-after analysis of crashes, we also wanted to compare the expected crash rate based on changes in traffic conditions,” said Brian Kary, Freeway Operations Engineer, MnDOT Metro District.

“Probably the most significant finding was that rear-end crash risk shows an inverted U-shaped relation to lane occupancy,” Gary Davis, Professor, University of Minnesota Department of Civil, Environmental and Geo-Engineering.

Davis served as the study’s principal investigator, and Kary was the technical liaison.

What Was the Need?

A left lane on I-35W marked as a PDSL. The variable message sign shows a diamond shape (signifying a high-occupancy-only lane) and a price of 25 cents.
A PDSL automatically changes status based on traffic conditions. The diamond indicates that it is open as a high-occupancy-only lane.

The Urban Partnership Agreement (UPA) is a federally funded program managed by the Federal Highway Administration to explore ways to reduce congestion on urban freeways. The Twin Cities area was one of four urban areas selected to test several innovative technologies through the UPA. These included high-occupancy toll (HOT) lanes, engineered revisions to ramps and auxiliary lanes, and a priced dynamic shoulder lane (PDSL) system on segments of the Interstate 35 West (I-35W) corridor. Work on implementing these innovations in the Twin Cities ran from spring 2009 through fall 2010.

MnDOT may decide to incorporate selected innovations, including the conversion of bus-only shoulder lanes to PDSLs, in other corridors. Decision-makers needed to better understand the safety-related benefits associated with the UPA improvements.

What Was Our Goal?

The goal of this project was to compare the incidence of crashes occurring on I-35W before and after implementation of the UPA improvements. Researchers wanted to determine whether any increase in crashes was due to the installation of the PDSLs or to other changes in the transportation network.

What Did We Do?

Researchers started by compiling data files on variables such as traffic volume and lane occupancy, weather conditions, and the presence or absence of UPA improvements for the relevant portions of I-35W. A second set of data was prepared using the Minnesota Crash Mapping Analysis Tool (MnCMAT) to identify crashes that took place on I-35W from 2006 to 2008 and from 2011 to 2013, the three years before and after the UPA project.

Investigators established three regions — HOT, Crosstown and PDSL — and divided each region into sections so that traffic demand and lane geometry would be constant within a section.

The data files were analyzed to determine the likelihood of a rear-end crash based upon the time of day, traffic volume, weather and other conditions.

What Did We Learn?

The analysis indicated that the increase in crashes on the most analyzed sections of I-35W was not likely the result of installation of PDSLs and other UPA improvements. A noted increase in crash rates was instead tied to reconstruction work that removed a bottleneck in the Crosstown Commons area, where I-35W shared right of way with Trunk Highway 62 (TH 62). There were some exceptions, however. Fewer crashes occurred on a section of the freeway south of I-494 during both study periods. An increase in rear-end crash risk north of the Minnesota River was due to weather and traffic conditions. In addition, researchers identified an inverted U-shaped relationship between lane occupancy and crash risk along several sections of the I-35W study area.

The findings supported the contention that PDSLs, when installed strategically, are safe and can provide transportation departments with an additional resource for managing congestion and improving traffic conditions along the Twin Cities freeway network.

Installation of PDSLs in the corridor did decrease the bottleneck at TH 62, but the improvement literally moved the problem down the road by creating a new bottleneck close to downtown Minneapolis.

From the MnCMAT database, the research team found 5,545 records of various types of crashes that took place from the beginning of I-35W to the I-35W/I-94 junction during the two three-year study periods. Rear-end crashes were by far the most prevalent type of crash, with 1,513 recorded before the UPA improvements and 1,657 during the three subsequent years.

Researchers encountered some challenges in preparing the data files for analysis. Careful screening of loop detector data was needed to identify questionable statistics and required a review of individual crash reports to verify crash locations.

What’s Next?

Through this research, MnDOT gained valuable insights into the impact of the UPA improvements on crash incidents along areas studied on the I-35W corridor. The methodology employed supports using PDSLs on other sections of the freeway network.


This post pertains to Report 2017-22, “Safety Impacts of the I-35W Improvements Done Under Minnesota’s Urban Partnership Agreement (UPA) Project,” published in June 2017.

Developing a Uniform Process for Quantifying Research Benefits

Researchers worked with MnDOT technical experts to develop a method for identifying the financial and other benefits of MnDOT research projects. They developed a seven-step process for quantifying benefits and applied the process to 11 recent MnDOT research projects. Results showed that these projects were yielding significant financial benefits.

“We have very high expectations for the research dollars we spend,” said Hafiz Munir, Research Management Engineer. “MnDOT Research Services & Library. Following this project, we now ask investigators to tell us upfront what benefits their research could achieve, and we have improved our internal process for tracking and assessing the quantifiable benefits.”

“A lack of before-research data on the transportation activities being studied may be the biggest challenge to quantifying the benefits of research on Minnesota transportation needs. Other states are also trying to do this, but they use informal or ad hoc processes,” said Howard Preston, Senior Transportation Engineer, CH2M Hill.

What Was the Need?

MnDOT Research Services & Library manages more than $10 million in research each year, with 230 active projects covering everything transportation-related — from subgrade soils to driver psychology. Communicating the value of these research investments is an important component of transparency in government, a core interest in Minnesota.

Quantifying the benefits of research projects that lead to innovations such as new and improved materials, methods and specifications is important to MnDOT and its customers. However, because MnDOT conducts such a wide variety of research projects, it is challenging to assess the benefits that will, when applied in practice, result in quantifiable savings of time, materials or labor, or that will lead to safer roads and fewer traffic crashes.

What Was Our Goal?

MnDOT undertook this project to develop a more systematic method for identifying and measuring the financial and other benefits of its research in relation to the costs. The goal was to develop an accessible, easily applicable process that could be pilot-tested on a selection of MnDOT research projects from recent years.

What Did We Do?

MnDOT provided researchers with documents about benefits quantification practices to review and with the results of a survey of state departments of transportation on their approaches to quantifying research benefits. This review identified few states that had developed formal guidelines for assessing research benefits, and none were easily applicable to MnDOT procedures.

After reviewing the findings and consulting with MnDOT technical experts, investigators recognized that any procedure for quantifying benefits should be rooted in current MnDOT research processes. Researchers worked with a number of MnDOT offices to identify research projects that were suitable for assessing financial and other benefits from research results.

In addition to identifying projects for benefits analysis, investigators and MnDOT identified categories of benefits and developed a seven-step process for gathering and organizing cost data for various project types, applying a benefits assessment process and comparing benefits to research cost.

What Did We Learn?

The research team performed benefit-cost assessments for 11 projects. Six of the assessments had high confidence levels. One challenge in developing a uniform process included refining the complex range of cost input categories, input data options and research objectives associated with the research projects. Assembling and organizing before-research data, even for fairly simple maintenance activities, proved particularly challenging and impeded the development of benefits assessment processes.

Investigators developed a user guide, a training presentation and a quantification tool — a complex set of spreadsheets for inputting data and calculating comparative benefits. The quantification tool should eventually develop into a user-friendly software package or Web interface.

SAFL baffle
The SAFL baffle was developed in a MnDOT research project for $257,000. Researchers determined that its use across Minnesota would save taxpayers $8.5 million over three years.

Based on the analysis of cost and savings data, the 11 research projects showed significant benefits. In one 2012 project, investigators developed an inexpensive baffle that is inserted into stormwater sumps and slows the flow of water in and out, allowing more contaminated sediment to settle rather than being carried into streams and lakes. Re-search to develop the baffle, at the University of Minnesota St. Anthony Falls Laboratory (SAFL), cost $257,000. The cost to purchase and install the baffle is about $4,000 in Minnesota compared to $25,000 for more traditional stormwater mitigation solutions. Use of SAFL baffles in Minnesota is projected to save the state about $8.5 million in equipment, installation and environmental costs over a three-year period.

In total, the research cost of $1.98 million for the 11 projects analyzed is expected to save an estimated $68.6 million for MnDOT and Minnesota cities and counties over a three-year period, for a benefit-to-cost ratio of about 34-to-1. The expected savings will be enough to pay for the research budget for six or seven years.

What’s Next?

MnDOT has added quantification-of-benefits elements to its research proposal evaluation process, and since late 2015 has asked potential principal investigators to supply information on the current costs of the activities they propose to study and improve.

Since 2016, research project awards have included a request that investigators develop quantifiable data resulting from their research activity. The awards offer additional funds for that work. Investigators now provide a brief memorandum within the first 90 days of the project describing how they will quantify benefits, and in some cases presenting preliminary data. At the end of the project, these investigators describe their quantification process and results. MnDOT has tracked this information in a database, finding that about three out of every four projects show potential to yield quantifiable benefits.


This post pertains to Report 2017-13, “Development of a Process for Quantifying the Benefits of Research,” published July 2017.