

Managed lanes provide transportation agencies with a strategy for reducing congestion and improving travel times along urban highways. A common perception is that the benefits of managed lanes are greater for higher-income people than for those with lower incomes, often from underrepresented communities. New research illustrates the diversity of managed lane users and provides new metrics and recommendations to factor equity into the highway project planning process.
Continue reading Maximizing Equity in Managed Lane PlanningTag Archives: congestion

COVID-19 Travel Reductions: Lessons for Relieving Traffic Congestion
As the COVID-19 pandemic restrictions in 2020 kept people at home, reduced travel and, therefore, traffic congestion were to be expected. But how much of an impact did the restrictions have on traffic congestion? After analyzing changes in traffic levels due to the COVID-19 pandemic travel restrictions, researchers identified how incremental changes in vehicle miles traveled impact regional congestion. These results will inform efforts by MnDOT and its partners on the outcomes of reduced travel demand.
Continue reading COVID-19 Travel Reductions: Lessons for Relieving Traffic Congestion
Making Freeway Travel Times in the Twin Cities Area More Reliable
Providing consistent freeway travel times for Twin Cities area drivers requires careful traffic management and well-planned freeway projects. To effectively respond to incidents and identify the most needed renovations, MnDOT traffic managers need to know precisely where, when and why congestion is happening.
Continue reading Making Freeway Travel Times in the Twin Cities Area More Reliable
New Project: What COVID Travel Reductions Tells Us About Effective Congestion Relief
As Minnesota worked to slow the transmission of COVID-19 in 2020, travel on MnDOT roadways dropped sharply and carried with it a corresponding drop in congestion.
Continue reading New Project: What COVID Travel Reductions Tells Us About Effective Congestion Relief
New performance measures identify truck delays and bottlenecks
A new freight transportation study takes the next step in lessening traffic bottlenecks by pinpointing location and time of recurrent delays.
Freight transportation provides significant contribution to our nation’s economy. Reliable and accessible freight network enables business in the Twin Cities to be more competitive in the Upper Midwest region. Accurate and reliable freight data on freight activity is essential for freight planning, forecasting and decision making on infrastructure investment.
Researchers used detailed and specific data sets as tools to investigate freight truck mobility, reliability and extent of congestion delays on Twin Cities metropolitan area corridors. Precise locations and times of recurrent delays will help to mitigate future traffic bottlenecks.
“This research provided tools and metrics with new levels of precision concerning truck congestion. The results will allow us to take the next steps toward future investment in addressing freight bottlenecks,” said Andrew Andrusko, Principal Transportation Planner, MnDOT Office of Freight and Commercial Vehicle Operations.
What Was the Need?
The corridors of the Twin Cities metropolitan area (TCMA) provide a freight transportation network that allows regional businesses to be competitive in the Upper Midwest. However, traffic volumes on many of these roadways are facing overcapacity during peak travel periods. Heavy truck traffic is only expected to increase, and delays will continue to disrupt freight schedules.
A 2013 study by MnDOT and the Metropolitan Council suggested the need to identify when and where truck congestion and bottlenecks developed in the TCMA. Previous research funded by MnDOT examined heavy truck movement along 38 Twin Cities freight corridors. Researchers created freight mobility and reliability measures, and worked to identify significant bottlenecks. Further research was needed to extract more precise data to better understand TCMA freight traffic congestion.

What Was Our Goal?
The aim of this project was to combine data from the U.S. DOT National Performance Management Research Data Set (NPMRDS) with information from other sources to build on the previous study’s analyses of mobility, reliability and delay along key TCMA freight corridors. New performance measures would more clearly identify the extent of system impediments for freight vehicles during peak periods in selected corridors, allowing researchers to identify causes and recommend mitigation strategies.
What Did We Do?
Researchers worked with stakeholders to prioritize a list of TCMA freight corridors with NPMRDS data coverage. The NPMRDS includes travel time data from probe vehicles at five-minute intervals for all National Highway System facilities. The travel times are reported based upon Traffic Message Channel (TMC) segments with link lengths varying from less than 1 mile to several miles. Researchers worked with 24 months of NPMRDS data from the selected corridors.
Because of varying TMC segment lengths, researchers used geographic information system (GIS)–based data to georeference the NPMRDS data to relevant maps. Combining these with average travel time data from passenger and freight vehicles, researchers used their data analysis framework to generate measures of truck mobility, reliability and delay at the corridor level.
A truck mobility analysis of all the selected corridors was performed using the truck-to- ar travel time ratio (TTR) for each TMC segment of each five-minute interval computed in AM (6-10 a.m.), midday (10 a.m.-4 p.m.) and PM (4-8 p.m.) peak periods using the 24- month NPMRDS data. A TTR of 1 describes a truck and a car traveling a distance in the same amount of time. On average, trucks are known to travel 10 percent slower than cars on freeways: a TTR of 1.1. A truck traveling 20 percent slower would have a TTR of 1.2.
Reliability measures evaluated the truck travel time reliability. Researchers computed truck delay during rush hour on the GIS network by fusing truck volumes, posted speed limit and NPMRDS data.
Researchers computed a truck congestion measure by comparing truck travel time with the target travel time in each TMC segment, which provided a measure of delay (in lost hours) at the segment and corridor level.
What Did We Learn?
The truck mobility analysis revealed that roadways with intersections have a higher TTR. Trucks on U.S. and Interstate highways take about 10 percent longer to travel the same distance as cars: TTR 1.1. On state highways, the TTR reaches 1.2 and 1.4 in the AM and PM peak periods, respectively. On county roads, trucks slow considerably: midday TTR is 1.5 and spikes to 1.7 and 1.9 in the AM and PM peak periods. Intersections in a TMC segment and delays at signalized intersections could have caused the TTR increases.
All reliability measures indicated that truck travel time in the PM peak period is less reliable than in the AM peak period. Similar to the TTR measure, roadways with signalized or unsignalized intersections were less reliable for truck traffic than freeways.
Truck congestion and delay measures revealed that the top five TCMA corridors with significant congestion had an average delay of over 3,000 hours in the AM and PM peak periods, with the PM delays notably greater. Also, in the AM peak period, eight additional interchanges had average delays of over 300 hours per mile. In the PM peak period, nine interchanges and eight segments showed significant congestion.
The top six TMC noninterchange segments exhibiting recurring PM peak period delays on average weekdays had delays ranging from 495 hours to 570 hours per mile.
Insufficient capacity, increasing demand, roadway geometry and density of weaving points (on-and off-ramps) were considered key causes of delay among these six bottlenecks.
What’s Next?
NCHRP Research Report 854, Guide for Identifying, Classifying, Evaluating and Mitigating Truck Freight Bottlenecks, provides guidelines for identifying, classifying, evaluating and mitigating truck bottlenecks. Follow-up research by MnDOT could potentially leverage this project’s effort with the NCHRP guidelines to develop mitigation strategies.
This post pertains to Report 2018-15, “Measure of Truck Delay and Reliability at the Corridor Level, published April 2018.

Do Lower Cost Improvements to Address Congestion Lead to More Crashes?
An analysis of crash data revealed that congestion-related improvements implemented on I-35W in the Twin Cities did not introduce additional safety risks. When installed strategically, improvements like priced dynamic shoulder lanes can alleviate congestion and improve safety for motorists.
“Rather than just conducting a before-and-after analysis of crashes, we also wanted to compare the expected crash rate based on changes in traffic conditions,” said Brian Kary, Freeway Operations Engineer, MnDOT Metro District.
“Probably the most significant finding was that rear-end crash risk shows an inverted U-shaped relation to lane occupancy,” Gary Davis, Professor, University of Minnesota Department of Civil, Environmental and Geo-Engineering.
Davis served as the study’s principal investigator, and Kary was the technical liaison.
What Was the Need?

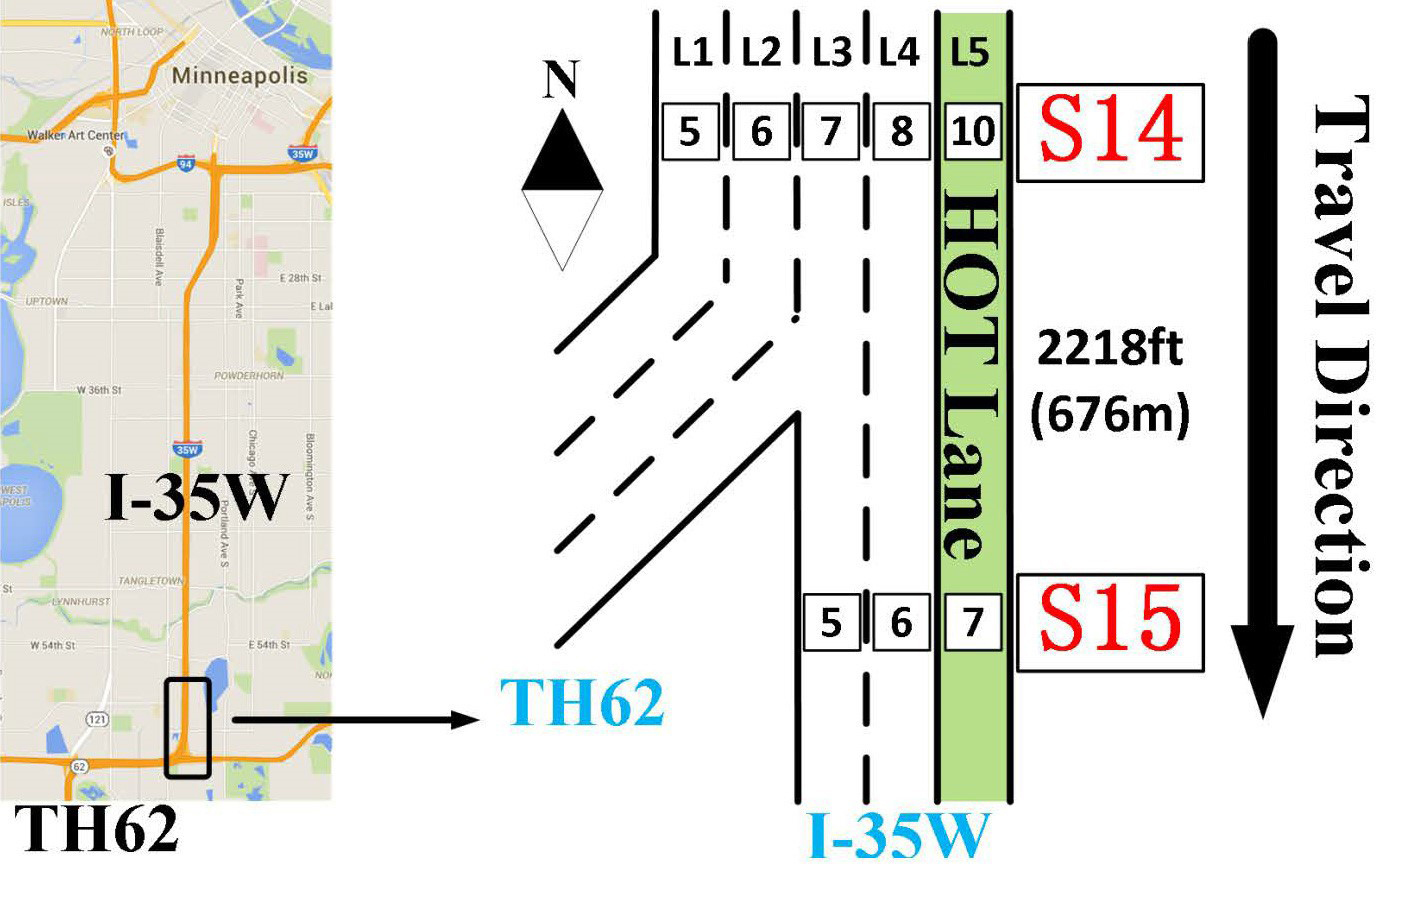
The Urban Partnership Agreement (UPA) is a federally funded program managed by the Federal Highway Administration to explore ways to reduce congestion on urban freeways. The Twin Cities area was one of four urban areas selected to test several innovative technologies through the UPA. These included high-occupancy toll (HOT) lanes, engineered revisions to ramps and auxiliary lanes, and a priced dynamic shoulder lane (PDSL) system on segments of the Interstate 35 West (I-35W) corridor. Work on implementing these innovations in the Twin Cities ran from spring 2009 through fall 2010.
MnDOT may decide to incorporate selected innovations, including the conversion of bus-only shoulder lanes to PDSLs, in other corridors. Decision-makers needed to better understand the safety-related benefits associated with the UPA improvements.
What Was Our Goal?
The goal of this project was to compare the incidence of crashes occurring on I-35W before and after implementation of the UPA improvements. Researchers wanted to determine whether any increase in crashes was due to the installation of the PDSLs or to other changes in the transportation network.
What Did We Do?
Researchers started by compiling data files on variables such as traffic volume and lane occupancy, weather conditions, and the presence or absence of UPA improvements for the relevant portions of I-35W. A second set of data was prepared using the Minnesota Crash Mapping Analysis Tool (MnCMAT) to identify crashes that took place on I-35W from 2006 to 2008 and from 2011 to 2013, the three years before and after the UPA project.
Investigators established three regions — HOT, Crosstown and PDSL — and divided each region into sections so that traffic demand and lane geometry would be constant within a section.
The data files were analyzed to determine the likelihood of a rear-end crash based upon the time of day, traffic volume, weather and other conditions.
What Did We Learn?
The analysis indicated that the increase in crashes on the most analyzed sections of I-35W was not likely the result of installation of PDSLs and other UPA improvements. A noted increase in crash rates was instead tied to reconstruction work that removed a bottleneck in the Crosstown Commons area, where I-35W shared right of way with Trunk Highway 62 (TH 62). There were some exceptions, however. Fewer crashes occurred on a section of the freeway south of I-494 during both study periods. An increase in rear-end crash risk north of the Minnesota River was due to weather and traffic conditions. In addition, researchers identified an inverted U-shaped relationship between lane occupancy and crash risk along several sections of the I-35W study area.
The findings supported the contention that PDSLs, when installed strategically, are safe and can provide transportation departments with an additional resource for managing congestion and improving traffic conditions along the Twin Cities freeway network.
Installation of PDSLs in the corridor did decrease the bottleneck at TH 62, but the improvement literally moved the problem down the road by creating a new bottleneck close to downtown Minneapolis.
From the MnCMAT database, the research team found 5,545 records of various types of crashes that took place from the beginning of I-35W to the I-35W/I-94 junction during the two three-year study periods. Rear-end crashes were by far the most prevalent type of crash, with 1,513 recorded before the UPA improvements and 1,657 during the three subsequent years.
Researchers encountered some challenges in preparing the data files for analysis. Careful screening of loop detector data was needed to identify questionable statistics and required a review of individual crash reports to verify crash locations.
What’s Next?
Through this research, MnDOT gained valuable insights into the impact of the UPA improvements on crash incidents along areas studied on the I-35W corridor. The methodology employed supports using PDSLs on other sections of the freeway network.
This post pertains to Report 2017-22, “Safety Impacts of the I-35W Improvements Done Under Minnesota’s Urban Partnership Agreement (UPA) Project,” published in June 2017.

ATM Queue Warning Systems Can Reduce Freeway Crashes
ATM queue warning systems were developed and deployed on two freeways to alert motorists to queuing conditions ahead that could lead to rear-end crashes. At one test site, the prototype system substantially reduced crashes and near-crashes. At the other site, it reduced speed variances.
“The big lesson learned was that the detection method had to function quickly and display a message that was timely and accurate. This gains the trust and confidence of the motoring public,” said Brian Kary, Freeway Operations Engineer, MnDOT Metro District.
“Deploying the product of this research was not difficult. The challenge came in closing the gap to alert the drivers to slow down,” said John Hourdos, Director, Minnesota Traffic Observatory, University of Minnesota.
Kary served as the technical liaison for the study, and Hourdos was the principal investigator.
What Was the Need?
To reduce congestion and improve safety, MnDOT has deployed active traffic management (ATM) technology on two highways in the Twin Cities freeway network. The ATM system incorporates intelligent lane control signals (ILCS) placed over selected lanes at half-mile increments to warn motorists of incidents or hazards ahead. With advance warning, drivers can slow down and possibly avoid crashes.
The deployed system, however, does not specifically target the prevention of rear-end collisions, which are the most frequent type of crashes on freeways. Research has shown that rear-end collisions tend to occur during extended lines of stop-and-go traffic and at end-of-queue locations. Overhead, real-time electronic messages that warn of queuing conditions ahead can prepare motorists to reduce speed and avoid potential rear-end collisions. Such messages have the added benefit of improving mobil-ity since fewer crashes will improve traffic flow.
What Was Our Goal?
This project sought to develop and field-test two different prototypes for ATM queue warning systems. One prototype would address stop-and-go traffic and end-of-queue situations. The other would address shock waves, a crash-facilitating condition where there is a sudden change in traffic movement that causes a cascade of braking. The long-range goal of the project is to develop a unified ATM queue warning system that can be deployed at other locations within the freeway network.
What Did We Do?
Development of two prototype high-resolution ILCS warning systems began in 2014. The systems were then deployed on two high-traffic freeways in the Twin Cities: one on Interstate 35 West (I-35W) and the other on I-94. Both were still in operation in mid-2017.
The two locations have significantly different traffic conditions. On I-35W, congestion creates expanding queues that extend from the Trunk Highway 62 (TH 62) interchange to the 50th Street overpass. At the I-94 location, crashes are most likely to occur due to shock waves that can often quickly develop near the Portland Avenue overpass.
 To capture traffic data, researchers used either live video from closed-circuit-camera detector stations or data from existing in-pavement loop detectors. The ILCS units dis-played the message Slow Traffic Ahead, which would direct drivers to reduce speed due to the congested lanes ahead. Other messages, such as Prepare to Stop or Traffic Ahead 10 MPH, were considered but not tested during this initial study.
A server installed at the Minnesota Traffic Observatory at the University of Minnesota archived the time and location of each queue on I-94 and measured its duration and length. This provided the data needed to develop two algorithms that can be used to develop a rear-end-collision warning system that can be installed at freeway locations where similar queuing conditions exist.
What Did We Learn?
The data collected show that warning messages delivered by the ATM system can be effective in alerting drivers to queuing conditions. The ultimate benefit is a reduction in rear-end collisions in downstream locations on the freeway.
Data recorded at the I-35W location revealed that:
- Messages delivered by the ILCS system helped drivers maintain a steady speed and eliminate stop-and-go travel.
- The contents of warning messages should be crafted to have an impact on all motorists. Drivers responded differently to specific messages.
- Queue warning systems can be made more effective through deployment of a real-time, lane-specific ILCS system and collection of high-resolution data.
- Some drivers did not always heed the first queue warning message to decrease speed, but they did slow down further along the roadway.
- There was no significant difference in impact between warning messages issued during the morning peak travel period and those issued during the evening peak.
In the first three months of queue warning system operation, the crash frequency re-corded at the I-94 test site was 9.34 crashes per vehicle miles traveled (VMT) and 51.8 near-crashes. This was a 22 percent decrease from the 11.9 crashes per VMT recorded at the site in 2013 monitoring data, and a 54 percent decrease from the 111.8 near-crashes recorded there in 2013.
The research showed that to prevent potential collisions, the ATM system had to deliver messages quickly and accurately to give drivers enough time to adjust their speeds. Also, the control algorithms developed in this project can provide the queue-estimation projections needed by MnDOT and other transportation departments to enhance the effectiveness of their ATM systems.
What’s Next?
While the deployment of the two queue warning system prototypes was a relatively cost-effective option, a longer trial period of two to three years is needed to ensure that the ATM system delivers sustainable benefits.
This Technical Summary pertains to Report 2017-20, “Development of a Queue Warning System Utilizing ATM Infrastructure System Development and Field Testing,” published June 2017.

Project seeks to ease traffic congestion in a roundabout way
Freeways and highways aren’t the only urban roads with traffic congestion, even though traffic management strategies have been largely directed toward improving traffic flows there. So, U of M researchers have taken to city streets to reduce congestion in an innovative—albeit roundabout—way.
“There’s been a lot of research focused on controlling congestion on major highways and freeways, but there’s relatively less when it comes to looking at controlling traffic on urban arterials,” says Ted Morris, a research engineer with the Department of Computer Science. “It’s a very different picture when you get into urban arterials and the traffic behaviors going on there, because of the dynamics of route choice, pedestrian interactions, and other factors.”
Morris is part of a research team that aims to create a framework for testing and evaluating new urban traffic sensing and control strategies for arterial networks. The goal is to balance safety and efficiency for all users—especially in places where new types of urban transportation facilities are planned in the next few years.
The team is using the 66th Street corridor in Richfield as a test bed for its research. The city, along with Hennepin County, is in the process of converting a series of signalized intersections along the route to roundabouts over the next few years. The roundabout designs also incorporate new facilities for pedestrians, bikes, and bus transit as part of a multimodal approach.
Initially, the researchers sought to create a larger network of interconnected sensors and a live test bed, Morris says. But funding limitations kept the project area to approximately 10 miles of arterial roads, a portion of which will be supported by a network of interconnected traffic sensors. The research team is instrumenting major intersections along 66th Street with a reliable, low-cost, high-resolution camera mounted on a center pole and supporting electronics as the intersections are being reconstructed.
“You can zoom in pretty closely to capture all the different movements and events that we need to use for measurement and detection,” Morris adds. “The key to this, to really make it reliable, is you need to very carefully quantify gap acceptance and how that varies in time and time of day. You also need to know how pedestrian activities interact with the traffic flow.”
The use of roundabouts has grown in the region because they cost less to build and maintain than signalized intersections, they meet the latest design standards, and they improve safety by reducing traffic conflicts. But predicting the capacity of roundabouts can be especially challenging when factoring in pedestrian traffic, uneven traffic origin-destination flow, heavy vehicle volumes, and approach vehicle gap-selection timing.
In addition to creating a sensor network to obtain real-time vehicle and pedestrian data to help control traffic and keep it flowing smoothly, the researchers also are developing a traffic simulation model that includes almost all of Richfield—more than 140 signalized intersections covering 21 square miles, including the arterials. The simulation model will be used to develop and test traffic control strategies under different scenarios. Minnesota Traffic Observatory director John Hourdos is leading that effort.
This research and the field deployment system are funded through a collaborative grant from the National Science Foundation Cyber Physical Systems program. SRF Consulting is the industrial partner to help design the sensor network and evaluate the system.

Major Ramp Metering Upgrade Reduces Freeway Delays
Motorists are experiencing less delay on metro-area highways, thanks to major changes to the Twin Cities’ ramp metering system.
The Minnesota Department of Transportation has reconfigured ramp meters to be more in sync with real conditions. With changes to the turn-on and turn-off criteria, the meters are actually running for a shorter period of time and are only activated when needed.
Ramp meters are traffic lights placed on freeway entrance ramps that control the frequency that vehicles can enter the highway. Sensors embedded in the pavement collect the vehicle traffic data used to time approximately 440 ramp meters.
Staff at the Regional Transportation Management Center, which manages the ramp meters, say the whole system is operating better because of changes that were implemented approximately one year ago (based off a 2012 study).
University of Minnesota-Duluth professor Eil Kwon developed the system’s new software algorithms. In a case study of Highway 100, he found that the delay on the mainline dropped by nearly half.
On northbound Highway 100, the amount of “delayed vehicle hours” — defined as the vehicle hours of traffic flow with speeds less than 45 mph — that motorists experienced dropped 48 percent during the months of October and November in 2012 when compared to the same period in 2011. During the same time period, total volume on that section of northbound Highway 100 increased by 2.7 percent, Kwon said. In spring 2013, the amount of delayed vehicle hours had been reduced by 17 percent.
These results are preliminary, as additional analysis is needed to determine if these results are typical throughout the system on other freeway corridors. However, based on a personal savings of $16.50 per hour, the scenario described above represents a cost savings to motorists of $1,353 to $3,447 per day (depending on the season). That’s as much as $339,150 to $861,640 per year for just a six-mile stretch of highway.
More efficient
Under the old system, each ramp meter would turn on based on current traffic conditions, but the criteria to turn on were easily met, causing the meters to turn on too soon. The old system did not have turn-off criteria, allowing meters to run until a pre-set time of day.
With the new system, improvements were made to make the meters respond more appropriately to current traffic conditions. The turn-on criteria were improved so that meters come on only when needed, and turn-off criteria were added, allowing meters to turn off when traffic conditions improved.
The new metering system is particularly effective at reducing the number of meters operating on light traffic days.
“On days like the ones leading up to Thanksgiving, where traffic may be 10-to-15 percent less than normal, instead of, say, 150 ramp meters being on at a particular time, now maybe only 50 ramp meters will be operating,” explained MnDOT Freeway System Operations Engineer Jesse Larson.
Upgrades to the ramp metering system also allow for a better picture of what traffic is like at a given moment, because it’s now based on corridor density rather than traffic flow.
Traffic flow is the measurement of the number of vehicles passing a given point. Using traffic flow was flawed, in that similar traffic flows can occur at different speeds. The old system couldn’t differentiate between 1,000 cars passing by at 20 miles per hour versus 1,000 cars passing at 60 miles per hour, for example.
Corridor density, on the other hand, is the number of vehicles per lane per mile. By measuring density instead of traffic flow, the system has a more accurate picture of what current conditions are like on the freeway.
Another bonus: ramp meters will no longer release a bunch of cars simultaneously once an entrance ramp fills up. That’s because the system can now detect the ramp filling up and release the extra cars gradually instead.

Related Resources
Development of Freeway Operational Strategies with IRIS-in-Loop Simulation study

