

Combining real-time traffic data, vehicle trajectories and computer algorithms allows queue warning systems to trigger traffic warnings on overhead message signs that alert drivers to congestion or crashes ahead. A recent study evaluated the warning system previously installed on a segment of Interstate 94 (I-94) and deployed the system in a second location, providing an improved understanding of its efficacy and considerations for expanding its use.
Continue reading Improving and Expanding the Queue Warning SystemTag Archives: RTMC

New System Measures Travel-Time Reliability to Reduce Traffic Delays
Researchers for the Minnesota Department of Transportation have developed a new travel-time reliability measurement system that automates the process of gathering and managing data from multiple sources, including traffic, weather and accident databases, to generate travel-time reliability measures and reports for the metropolitan freeway network.
What Was the Need?
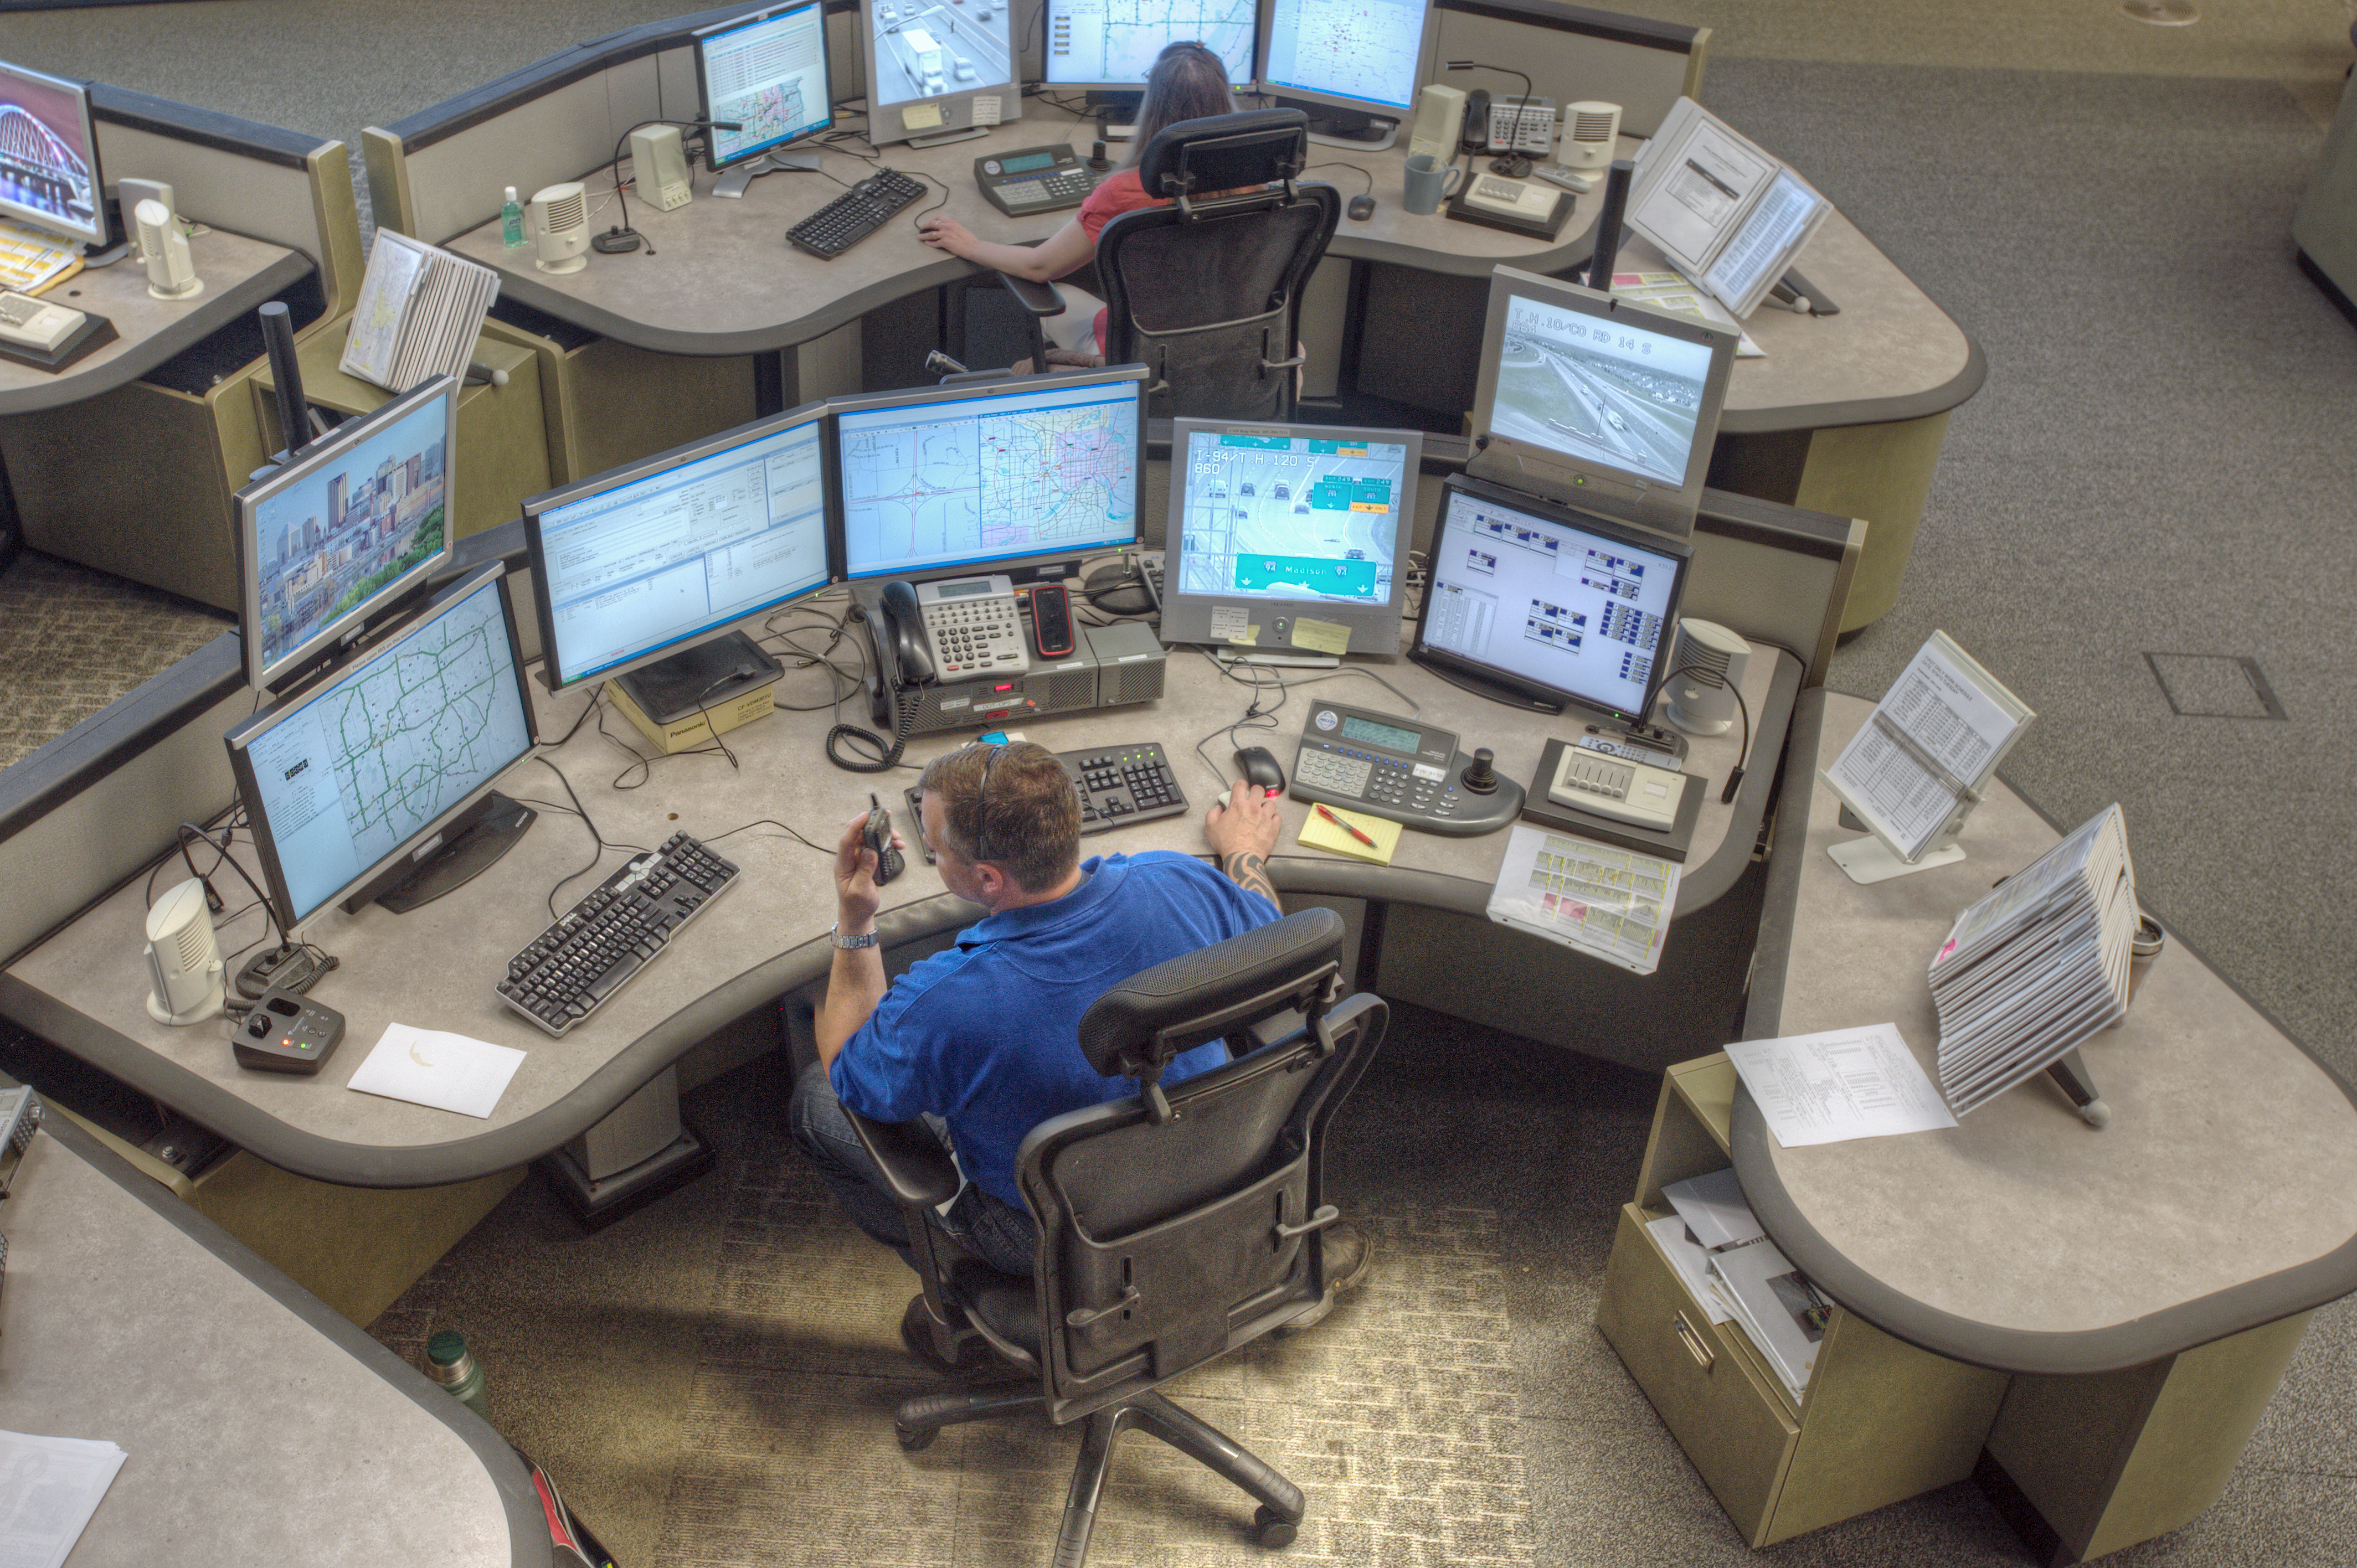
Improving traffic efficiency has become a key goal of traffic operations managers. In heavy traffic periods, MnDOT’s Regional Transportation Management Center (RTMC) coordinates with Minnesota State Patrol and MnDOT Maintenance Services to detect and quickly respond to freeway incidents in the Twin Cities. The RTMC works with the Freeway Incident Response Safety Team to assist and remove stranded vehicles using MnDOT emergency road service trucks. RTMC also updates real-time road condition information on its 511 traveler information system.
bad weather and road construction that cause freeway congestion.
MnDOT and RTMC measure delay and congestion on the metropolitan freeway system, reporting the data in annual reports like the 2017 Congestion Report. While useful, this data offers little predictive value on its own. MnDOT’s metropolitan freeway system features 4,000 loop detectors that transmit traffic data every 30 seconds; this data informs the congestion and delay reports.
Correlating this data with locations on the freeway system and various operating conditions, such as weather and traffic incidents, is time- consuming. But the data could be used to systematically evaluate traffic delays and develop strategies to mitigate congestion.
What Was Our Goal?
In this project, investigators sought to develop a system for automatically accessing weather, crash and traffic data to assess travel-time reliability—the variability in travel times for any given route. Travel-time reliability measures are becoming the key indicators for transportation system operations and management.
What Did We Implement?
Investigators developed a new travel-time reliability measurement system (TTRMS) that integrates different types of data (such as weather, traffic, incident, work zone and special event) acquired from multiple sources and automatically produces various types of travel-time reliability measures for selected corridors following user-specified operating conditions and time periods.
“Travel-time reliability is another way of looking at congestion and at strategies for making it more tolerable. It used to take several hours, even days, to process travel-time reliability data. The TTRMS processes it in minutes,” said Brian Kary, Director, MnDOT Regional Transportation Management Center.
How Did We Do It?
Investigators began by developing a detailed design of the TTRMS architecture—its modules, their functions and their interactions. The team then developed a work-zone data input module, where detailed lane configurations of a given work zone can be specified.
Developers designed a travel-time reliability calculation module as the core of the new system that can automatically access MnDOT’s traffic data archive, its incident database and the National Oceanic and Atmospheric Administration’s weather database. It can also accept a set of input data for work zones, such as lane-closure periods and locations. The reliability calculation module was then integrated with user interfaces and reporting modules. Finally the integrated system was tested with the real data gathered in 2012 and 2013 from Interstates 35E and 35W, U.S. Highway 169 and State Highway 100.
What Was the Impact?
The system generated accurate travel-time reliability measures for the test periods and given operating conditions. In particular, the output measures were automatically generated in both table and graphical formats, thus saving traffic engineers significant amount of time and effort.
The TTRMS includes map-based interfaces, which provide administrators and general users with substantial flexibility in defining corridors, specifying operating conditions and selecting types of measures depending on the purposes of applications.
To test the new system’s performance, the research team used the TTRMS to evaluate traffic strategies deployed for the February 2018 Super Bowl in Minneapolis. Two weeks before the event, reliability was low for the freeway system serving the football stadium. During the week of the Super Bowl, MnDOT and the Department of Public Safety aggressively managed traffic incidents to keep traffic moving, and reliability rose substantially despite the increase in tourist traffic. In the days immediately after the Super Bowl, operational strategies returned to normal levels, and reliability fell to previous levels. Results suggest that aggressive incident management during this exceptionally high-volume regional event enhanced traffic efficiency.
What’s Next?
Further enhancements to the TTRMS should include automating inputs for work zone data, such as lane closures, changes in work zone locations and time periods. Future research could help traffic operations prioritize resources and develop short-term and long-term freeway improvements, including studies of bottlenecks and the freeway network’s vulnerability and resilience for natural events and large-scale incidents.
This post pertains to Report 2018-28, “Development of a Travel-Time Reliability Measurement System,” published September 2018.

New Software Models MnPASS HOT Lane Changes
Until recently, Minnesota drivers could only enter or exit high-occupancy toll (HOT) lanes via select ramps and access points. But MnDOT has changed most of its MnPASS express lanes to an open-access system to allow more movement between general purpose and high-occupancy toll (HOT) lanes.
Although MnDOT prefers this open access system, there could safety concerns for allowing lane changes in certain locations, especially if traffic patterns change. A new design tool developed by MnDOT-sponsored research enables traffic engineers to evaluate existing or prospective HOT corridors and determine the impact of open or closed access. When data shows changes in traffic patterns and congestion, the software also allows technicians to model and design changes in MnPASS access to improve drive mobility and safety.
“Nothing like this has been developed anywhere else. There is a lot of debate around the country about high-occupancy designs. This tool helps us develop designs and monitor existing corridors,” said Brian Kary, Director of Traffic Operations, MnDOT Regional Transportation Management Center.
Background
In Minnesota, high-occupancy toll (HOT) lanes are used by buses, carpools and motorists with transponders that trigger payments for rush hour use. During rush hour, fees increase as congestion increases; at other times, the lanes are free for all users.
MnDOT research in 2014 concluded that both closed and open HOT lane configurations effectively and safely improve traffic capacity. But researchers anticipated that roadway sections on an HOT lane corridor may eventually experience safety and mobility problems if toll prices are lowered or traffic volume increases. During heavy traffic, driving speeds often vary dramatically between HOT and general purpose lanes. Drivers moving into MnPASS lanes may force other drivers to brake suddenly to avoid collisions and trigger shockwaves of slowed or stopped traffic behind them. MnDOT prefers open-access designs for the increased options they offer road users, but it was not clear how best to manage access to reduce the incidence of shockwaves and the safety and mobility problems they create.

The goal of this research implementation effort was to develop a software tool that the Regional Transportation Management Center (RTMC) could use to assess corridor operations and design. Based on design recommendations from earlier research, the tool would allow RTMC users to predict the safety and mobility impacts of a change from open to closed HOT lanes, and estimate where in the corridor such changes could be implemented safely and effectively.
What Did We Implement?
This effort leveraged findings from three previous MnDOT studies. Models and methods from “Evaluation of the Effect of MnPASS Lane Design on Mobility and Safety” (Report 2014-23) were used for the architecture of this new system. Investigators drew on “Expanding and Streamlining of RTMC Freeway Network Performance Reporting Methodologies and Tools” (Report 2014-05) to implement methods for retrieving historical data from RTMC’s system, cleaning the data and integrating it into the new software package. The project team then incorporated data from “Safety Impacts of the I- 5W Improvements Done Under Minnesota’s Urban Partnership Agreement (UPA) Project” (Report 2017-22) to develop and calibrate the new tool for estimating traffic impacts and shockwaves. A car-following and lane-changing model developed in a 2013 University of Minnesota study provided effective methods for ensuring realistic vehicle modeling and shockwave generation.
How Did We Do It?
Investigators developed this system with links to MnDOT’s database to draw on historical data to identify patterns of traffic demand over time and generate predictions of points in the MnPASS lanes at which shifts from open- to closed-access HOT lanes will offer the most benefit. The program’s code integrates the various models, data sets and tools mentioned above into software that integrates smoothly with the RTMC’s current software and capabilities for collecting speed and volume data, developing interfaces to model impacts of changing open designs at certain points in the freeway corridor to closed designs. The tool includes a module for access design, a module for generating data and a web application.
“This tool is calibrated for the Twin Cities. It takes real-time data and diagrams each location separately for lane changes and reaction time. It took theoretical ideas and made them usable,” said John Hourdos, Director, Minnesota Traffic Observatory, University of Minnesota.
What Was the Impact?
After receiving training in using the new software, RTMC engineers have embraced the MnPASS design tool to regularly report MnPASS performance to the Federal Highway Administration and to generate quarterly and annual analyses and recommendations for changing specific locations from open access to closed access. Closing requires restriping and changing signage—operations that allow MnDOT to respond quickly and easily to shifts in traffic patterns and potential mobility and safety impacts.
The project also offers data for the broader transportation community in which experts debate the relative merits of open- and closed-access HOT designs. With MnPASS, MnDOT has emerged as a leader in open design; this software allows sophisticated modeling of design impacts for the national traffic operations community.
What’s Next?
The MnPASS design tool effectively monitors corridor behavior and design changes. Improvements may yet be made to allow data calibration and validation for slower traffic speeds that represent mobility breakdowns, and to refine aspects of car-following and shockwave models. Increased density scenarios can also be further improved to better accommodate traffic density increases in regular lanes alongside HOT lanes.
In its current form, the tool will be used to analyze open- and closed-access designs on the Interstate 394 corridor to determine the best locations for changes to MnPASS lanes, and positions MnDOT and the RTMC to respond to traffic demand changes in the future.
This post pertains to Report 2018-11, “A Tool for Designing MnPASS
Access Spacing,” published March 2018. The full report can be accessed at
mndot.gov/research/reports/2018/201811.pdf.

Major Ramp Metering Upgrade Reduces Freeway Delays
Motorists are experiencing less delay on metro-area highways, thanks to major changes to the Twin Cities’ ramp metering system.
The Minnesota Department of Transportation has reconfigured ramp meters to be more in sync with real conditions. With changes to the turn-on and turn-off criteria, the meters are actually running for a shorter period of time and are only activated when needed.
Ramp meters are traffic lights placed on freeway entrance ramps that control the frequency that vehicles can enter the highway. Sensors embedded in the pavement collect the vehicle traffic data used to time approximately 440 ramp meters.
Staff at the Regional Transportation Management Center, which manages the ramp meters, say the whole system is operating better because of changes that were implemented approximately one year ago (based off a 2012 study).
University of Minnesota-Duluth professor Eil Kwon developed the system’s new software algorithms. In a case study of Highway 100, he found that the delay on the mainline dropped by nearly half.
On northbound Highway 100, the amount of “delayed vehicle hours” — defined as the vehicle hours of traffic flow with speeds less than 45 mph — that motorists experienced dropped 48 percent during the months of October and November in 2012 when compared to the same period in 2011. During the same time period, total volume on that section of northbound Highway 100 increased by 2.7 percent, Kwon said. In spring 2013, the amount of delayed vehicle hours had been reduced by 17 percent.
These results are preliminary, as additional analysis is needed to determine if these results are typical throughout the system on other freeway corridors. However, based on a personal savings of $16.50 per hour, the scenario described above represents a cost savings to motorists of $1,353 to $3,447 per day (depending on the season). That’s as much as $339,150 to $861,640 per year for just a six-mile stretch of highway.
More efficient
Under the old system, each ramp meter would turn on based on current traffic conditions, but the criteria to turn on were easily met, causing the meters to turn on too soon. The old system did not have turn-off criteria, allowing meters to run until a pre-set time of day.
With the new system, improvements were made to make the meters respond more appropriately to current traffic conditions. The turn-on criteria were improved so that meters come on only when needed, and turn-off criteria were added, allowing meters to turn off when traffic conditions improved.
The new metering system is particularly effective at reducing the number of meters operating on light traffic days.
“On days like the ones leading up to Thanksgiving, where traffic may be 10-to-15 percent less than normal, instead of, say, 150 ramp meters being on at a particular time, now maybe only 50 ramp meters will be operating,” explained MnDOT Freeway System Operations Engineer Jesse Larson.
Upgrades to the ramp metering system also allow for a better picture of what traffic is like at a given moment, because it’s now based on corridor density rather than traffic flow.
Traffic flow is the measurement of the number of vehicles passing a given point. Using traffic flow was flawed, in that similar traffic flows can occur at different speeds. The old system couldn’t differentiate between 1,000 cars passing by at 20 miles per hour versus 1,000 cars passing at 60 miles per hour, for example.
Corridor density, on the other hand, is the number of vehicles per lane per mile. By measuring density instead of traffic flow, the system has a more accurate picture of what current conditions are like on the freeway.
Another bonus: ramp meters will no longer release a bunch of cars simultaneously once an entrance ramp fills up. That’s because the system can now detect the ramp filling up and release the extra cars gradually instead.

Related Resources
Development of Freeway Operational Strategies with IRIS-in-Loop Simulation study

Software Tool Cuts Time to Analyze Twin Cities Congestion
Newly developed software has drastically reduced the amount of time and effort required by MnDOT’s Regional Transportation Management Center (RTMC) to analyze congestion in the Twin Cities metropolitan area.
Developing MnDOT’s annual Metropolitan Freeway System Congestion Report used to be a manual process that could be applied to only a portion of the large quantity of data generated by in-pavement sensors.
The new Highway Automated Reporting Tool now automatically imports and cleans data to produce a report about the percentage of network miles congested during peak periods as well as three new reports on other performance measures.
The tool will help MnDOT engineers and planners better develop congestion reduction strategies and determine the most cost-effective investments in the network.
From RTMC’s control room, engineers monitor and manage 400 miles of Twin Cities freeway traffic using data from thousands of in-pavement sensors.
“Before HART, it took months to analyze freeway performance using traffic data from only the month of October. Now engineers can quickly analyze data from any time period, significantly improving traffic planning,” said Jesse Larson, Assistant Freeway Operations Engineer for MnDOT’s Metro District Regional Transportation Management Center.
The tool was developed in a MnDOT-funded study led by University of Minnesota researcher John Hourdos.
Note: This article was adapted from the May–June 2014 issue of our Accelerator newsletter. Sign up for your free print or email subscription by clicking here.
Resources
- Technical Summary (PDF, 1 MB, 2 pages)
- Final Report (PDF, 14 MB, 106 pages)
