Republished from CTS News (Catalyst) for October 14, 2025
More than 14,600 Minnesota residents applied for a rebate through the state’s e-bike rebate program when it launched in 2024. Established by the Minnesota Legislature to help reduce the cost of buying a new e-bike, the program was so popular that within minutes of opening in June 2024, the number of applicants overwhelmed the system and crashed the website. The state was forced to fix the technology challenges and reopen the application about a month later.
The scenario drove researchers at the University of Minnesota to dig deeper into the data about who applied for the rebate in the first year. Their project aims to shed light on who benefitted from the program, get feedback on the application process, and learn more about rebate use.
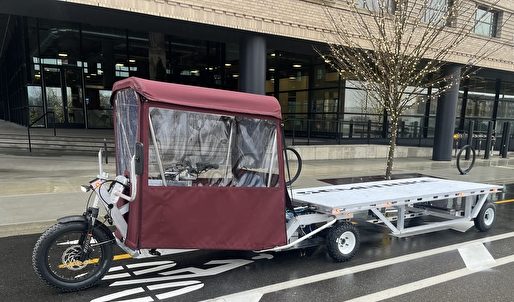
E-bikes, which operate like a bicycle but have an electric battery and motor for pedaling assistance, have increased in popularity in recent years, and supporters are promoting their potential as a sustainable transportation option. The state legislature allocated $2 million in both 2024 and 2025 for the rebate program.
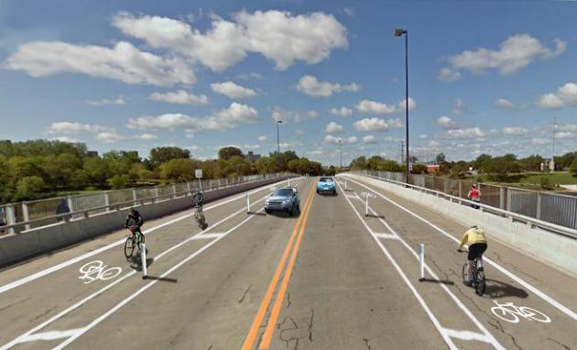
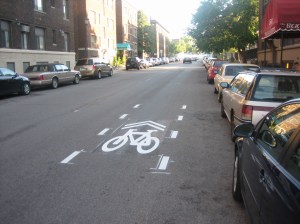
“Minnesotans seem to have an appetite to get an e-bike, whether that’s because of the state’s incentive or for other reasons—including that Minnesota has some of the best bike infrastructure around,” says Kaitlyn Denten, a researcher with the Humphrey School’s Institute for Urban and Regional Infrastructure Finance (IURIF) and project co-lead.
For the first part of this project, researchers analyzed rebate applicant data, which included demographic information, income level, tax filing status, and ZIP code but no personal identifiers. Data also included a person’s rebate application status, the rebate amount, and whether the applicant used the rebate to purchase a new e-bike.
In the program’s first year, the maximum rebate was $1,500; individual amounts depended on an applicant’s income level and tax filing status. People who applied for and received a rebate certificate could purchase their e-bike and eligible bike accessories from a participating retailer. Of the total applicants, 1,519 people received a rebate and 1,327 used one to purchase an e-bike. According to the data, half of the rebates went to households earning less than $75,000 a year.
The Twin Cities seven-county metro area had strong representation, with 66 percent of applicants, 67 percent of recipients, and 66 percent of rebate users coming from the metro area. The average age of applicants was 49 years old.
For the project’s second part, researchers used an online survey to collect feedback on the application process and information about how people who received a rebate were using their e-bike, among other data. The survey, which was available between March 17, 2025, and April 5, 2025, received nearly 4,500 responses.
Of the survey respondents, 3,920 individuals applied for a rebate, 496 received a rebate, and 455 used the rebate to purchase an e-bike. For those who received a rebate but didn’t use it, among the reasons cited were that the rebate didn’t cover enough of the e-bike’s cost and the rebate certificate expired before they were able to use it.
One surprising finding: Some people bought an e-bike even if they didn’t receive a rebate, says CTS scholar Camila Fonseca-Sarmiento, IURIF director of fiscal research and project co-lead. “Or, if a couple received a rebate, they ended up buying two e-bikes. This could be spurring the use of e-bikes instead of personal vehicles.”
Many survey respondents expressed frustration with the initial application process, referring to the technical glitches, long wait times, and unclear instructions. Several respondents did note, however, that the second application round ran more smoothly.
Some respondents also raised concerns about the fairness of the program’s rollout, pointing to barriers faced by people with limited internet access and electronic devices, people with disabilities, and people with inflexible work schedules (the application period opened on a weekday).
Future research should focus on the effects of 2025 program changes, including income eligibility, application processes, and rebate amount, the researchers say. In addition, researchers noted that a statewide travel study could help assess how rebates might influence a shift from personal vehicle use to an e-bike, a question left unanswered because of limited e-bike use among current rebate recipients.
This research project was sponsored by the Applied Research in Transportation (ART) Program, which addresses time-sensitive research questions in a 6 to 12 month timeframe. CTS and the Minnesota Department of Transportation contributed initial funding to launch this pilot program in 2024, with the Metropolitan Council joining in 2025. To reinforce the applied nature of the program, ART projects must directly address a current process, document, or policy need with an initial focus on sustainability in transportation and climate change impacts.
—Peter Raeker, contributing writer
Related Research from MnDOT
Operational Characteristics of Conventional and Electric-Assisted Bicycles and Their Riders (ongoing)
Assessing the Economic Impact and Health Benefits of Bicycling in Minnesota