Tag Archives: Active traffic management system

Major Ramp Metering Upgrade Reduces Freeway Delays

Motorists are experiencing less delay on metro-area highways, thanks to major changes to the Twin Cities’ ramp metering system.

The Minnesota Department of Transportation has reconfigured ramp meters to be more in sync with real conditions. With changes to the turn-on and turn-off criteria, the meters are actually running for a shorter period of time and are only activated when needed.

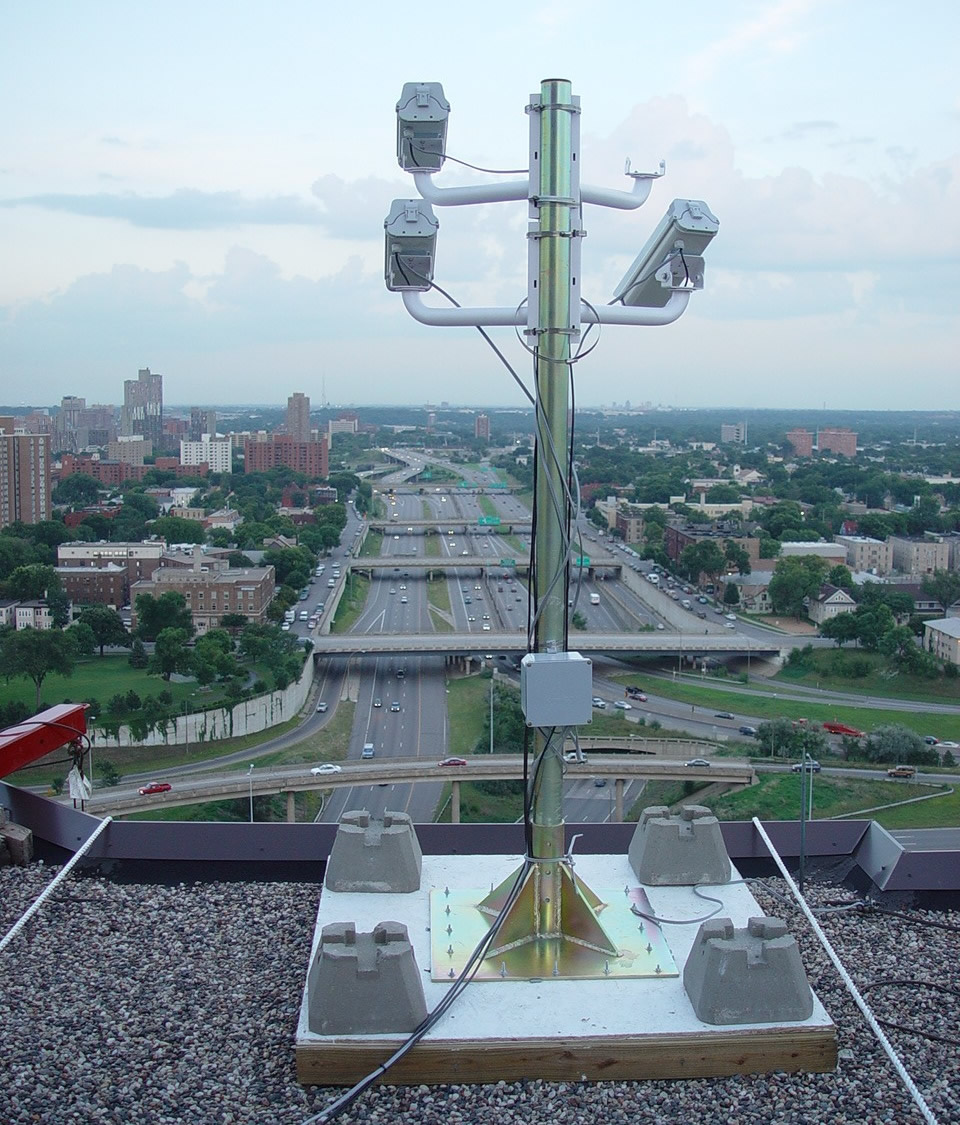
Ramp meters are traffic lights placed on freeway entrance ramps that control the frequency that vehicles can enter the highway. Sensors embedded in the pavement collect the vehicle traffic data used to time approximately 440 ramp meters.

Staff at the Regional Transportation Management Center, which manages the ramp meters, say the whole system is operating better because of changes that were implemented approximately one year ago (based off a 2012 study).

University of Minnesota-Duluth professor Eil Kwon developed the system’s new software algorithms. In a case study of Highway 100, he found that the delay on the mainline dropped by nearly half.

On northbound Highway 100, the amount of “delayed vehicle hours” — defined as the vehicle hours of traffic flow with speeds less than 45 mph — that motorists experienced dropped 48 percent during the months of October and November in 2012 when compared to the same period in 2011. During the same time period, total volume on that section of northbound Highway 100 increased by 2.7 percent, Kwon said. In spring 2013, the amount of delayed vehicle hours had been reduced by 17 percent.

These results are preliminary, as additional analysis is needed to determine if these results are typical throughout the system on other freeway corridors. However, based on a personal savings of $16.50 per hour, the scenario described above represents a cost savings to motorists of $1,353 to $3,447 per day (depending on the season). That’s as much as $339,150 to $861,640 per year for just a six-mile stretch of highway.

More efficient

Under the old system, each ramp meter would turn on based on current traffic conditions, but the criteria to turn on were easily met, causing the meters to turn on too soon. The old system did not have turn-off criteria, allowing meters to run until a pre-set time of day.

With the new system, improvements were made to make the meters respond more appropriately to current traffic conditions. The turn-on criteria were improved so that meters come on only when needed, and turn-off criteria were added, allowing meters to turn off when traffic conditions improved.

The new metering system is particularly effective at reducing the number of meters operating on light traffic days.

“On days like the ones leading up to Thanksgiving, where traffic may be 10-to-15 percent less than normal, instead of, say, 150 ramp meters being on at a particular time, now maybe only 50 ramp meters will be operating,” explained MnDOT Freeway System Operations Engineer Jesse Larson.

Upgrades to the ramp metering system also allow for a better picture of what traffic is like at a given moment, because it’s now based on corridor density rather than traffic flow.

Traffic flow is the measurement of the number of vehicles passing a given point. Using traffic flow was flawed, in that similar traffic flows can occur at different speeds. The old system couldn’t differentiate between 1,000 cars passing by at 20 miles per hour versus 1,000 cars passing at 60 miles per hour, for example.

Corridor density, on the other hand, is the number of vehicles per lane per mile. By measuring density instead of traffic flow, the system has a more accurate picture of what current conditions are like on the freeway.

Another bonus: ramp meters will no longer release a bunch of cars simultaneously once an entrance ramp fills up. That’s because the system can now detect the ramp filling up and release the extra cars gradually instead.

The amount of hours vehicles wait at entrance ramps fell by nearly 50 percent during the fall months along a section of Highway 100.
Twin Cities ramp meters now turn on and off based on live traffic conditions.

Related Resources

Development of Freeway Operational Strategies with IRIS-in-Loop Simulation study

What those signs over the freeway are actually telling you

Two years ago, MnDOT installed a series of electronic speed limit advisory signs over Interstate 94 between Minneapolis and St. Paul. The Variable Speed Limit (VSL) system is designed to reduce congestion and help prevent crashes by recommending lower speed limits to motorists during periods of high traffic.

The new technology has worked in other places, including China and Germany. In Minnesota, a similar VSL system on I-35W reportedly had moderate benefits in reducing the total amount of congestion during the morning commute south of Minneapolis.

Although the verdict on I-94 congestion is still pending,  a newly released study has found that the new system has not made a measurable impact so far on crashes in an accident-prone stretch of freeway in downtown Minneapolis. Why not?

University of Minnesota researcher John Hourdos has a few theories.

One is a simple time  lag in the congestion reporting system. Another is a requirement that all lanes display the same speed limit, which he said causes confusion when only one lane is actually congested. The complexity of the I-94 commons also appears to be beyond what the VSL system was designed to do. And according to Hourdos, one of the most significant problems is the driving public simply doesn’t understand what the signs are telling them.

“People do not know what the system really does,” Hourdos said. “There hasn’t been much education on it other than a couple of news articles over the years. And when they try to decipher it on their own they get even more confused.”

The I-94 Commons area has a major bottleneck where the I-35W northbound ramp merges with I-94 westbound (between Cedar Avenue and 11th Avenue). Vertical red lines indicate locations of gantries that display variable speed limit advisories.

The advisory speed limits are posted in response to varying traffic conditions. As vehicles approach the commons area, the system measures speeds at the bottlenecks. If the traffic slows, the system transmits a reduced advisory speed to drivers approximately 1.5 miles upstream from the location of the slow-down.

Hourdos said many motorists mistakenly believe the speed displayed on the signs is either a reflection of the speed on the current stretch of highway or an indication of the speeds on the highway ahead, rather than a suggested speed for them to follow.

The requirement to display the same speed limit on all signs also compounds the problem, Hourdos said, because when drivers see that the slowdown is only occurring in certain lanes they tend to ignore the signs altogether.

“In the lane that is congested, the real speeds drop much faster than what the VSL system can respond to, reducing the functionality of the system to the eyes of the drivers,” Hourdos said, “while on the fast-moving lanes, it seems the system has no purpose at all.”

From downtown Minneapolis rooftops, traffic monitoring cameras detect shockwaves on Interstate 94.
Data was primarily collected via cameras at the I-94 Commons’ Third Avenue Field station, overlooking an area with a particularly high crash rate.

So is the I-94 VSL system useless? Not necessarily. For one, the new study didn’t measure the system’s impact on congestion — only its ability to reduce crashes on a small portion of I-94. Moreover, the area in question, the I-94 Commons, is fairly unique, having two major bottlenecks, the highest crash rate in the state (nearly one every other day), and five hours of congestion during the afternoon rush hour alone.

“The VSL system was designed for implementation on any freeway and may not have been well-suited for the I-94 Commons area, which is a very complex corridor with high volume weaves and significant shockwave activity,” said MnDOT Freeway Operations Engineer Brian Kary.

Generally speaking, the VSL system was designed to identify slow traffic ahead of where free-flowing traffic is approaching slow or stopped traffic.

“The crash problems within the commons are caused by speed differentials between lanes and shockwave activity within the congestion,” Hourdos said. “The current VSL system was not developed to handle these types of conditions.”

MnDOT and the researchers aren’t giving up, either. A new project is starting later this year to develop and deploy a queue warning system specifically for this high-crash rate location.

Further resources

Investigation of the Impact of the I-94 ATM System on the Safety of the I-94 Commons High Crash Area (PDF), May 2014

Improving Traffic Management on Minnesota Freeways (PDF), May 2012