

As the COVID-19 pandemic restrictions in 2020 kept people at home, reduced travel and, therefore, traffic congestion were to be expected. But how much of an impact did the restrictions have on traffic congestion? After analyzing changes in traffic levels due to the COVID-19 pandemic travel restrictions, researchers identified how incremental changes in vehicle miles traveled impact regional congestion. These results will inform efforts by MnDOT and its partners on the outcomes of reduced travel demand.
Vehicle miles traveled (VMTs) correlate with traffic congestion, but the impacts of incremental changes in VMT on congestion over the region and in specific corridors are not well understood. When MnDOT and its partners propose or implement travel demand management strategies, they can enhance public and political support by identifying the traffic benefits. To the extent possible, they need to quantify benefits related to travel time savings and reliability, access to destinations and other benefits of relieving traffic congestion.
“The COVID-19 pandemic provided a real-life experiment correlating traffic congestion and VMT changes. We now have detailed information to support our travel demand reduction strategies at the segment, corridor and regional levels that we’ve never had before,” said Brad Utecht, director, MnDOT Investment Planning.
MnDOT wanted to better understand the impacts of reduced VMT to employ congestion reduction efforts and plan highway investments more effectively. With the changes in traffic patterns during the pandemic, they saw an opportunity to explore the relationship between VMT and congestion through real-life measurements.
What Was Our Goal?
The goal of this project was to understand the relationships between incremental changes in regional traffic volumes and highway congestion in the Twin Cities metropolitan area, including identifying the VMT levels at which congestion significantly declines or disappears.
What Did We Do?
By comparing actual traffic conditions before the pandemic, during COVID-19 stay-at-home restrictions and as the restrictions were lifted and traffic increased, researchers explored the relationship between VMT and congestion both regionally and in various corridors.
Collecting traffic volume and speed data from over 4,000 inductive loop detectors and radar sensors on MnDOT-defined freeway segments, they examined aggregated five-minute intervals during weekday morning and afternoon peak periods from October 2019 to November 2020. Researchers used MnDOT’s definition of freeway congestion—an average speed at or below 45 mph—and calculated VMT as the volume measured at each detector multiplied by the length of the segment in which the detector is located. They also examined differences in congestion across various corridors, analyzing how traffic volumes changed as regional congestion increased.

Finally, researchers conducted a limited investigation into two other issues. They examined data from 25 days covering pre-COVID and during-COVID conditions on four signalized arterials to observe impacts from regional congestion. To explore the equity implications of changes in congestion, researchers used travel data software and an origin–destination analysis to examine the commuting times of essential workers and certain environmental justice populations.
What Did We Learn?
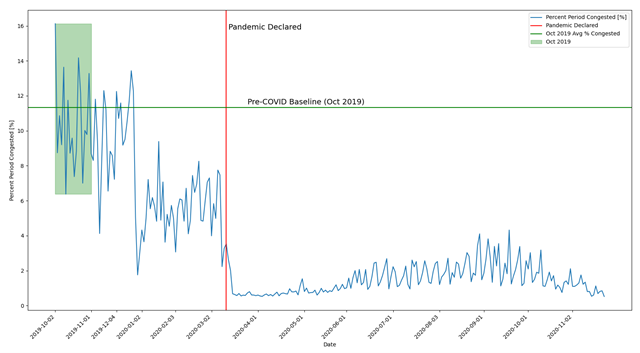
Researchers found that pre-pandemic (October 2019), congestion in the morning peak times was seen in 6.8% of observations, on average, while the afternoon peak observations averaged 11%. Immediately following the declaration of the COVID-19 pandemic in March 2020, traffic levels dramatically dropped, and school closings and Minnesota’s stay home order preceded further declines. Regional congestion effectively disappeared.
1%. Morning traffic trends were very similar, though VMT remained at levels well
below 2 million VMT as restrictions eased.
As the afternoon peak VMT crept back up to nearly 90% of pre-pandemic levels—or 7 million—observations with congestion remained at only 4%. By plotting regional VMT versus congestion over the study period’s afternoon peak traffic, researchers illustrated that VMT and congestion levels tracked relatively closely up to this point; after that, congestion grows exponentially.
A tipping point occurs once VMT reaches approximately 8.5 million, and about 8% of freeway segment observations showed congestion. At this point, traffic delay becomes volatile and spreads throughout the network. By identifying the curve and equation of the correlation, researchers defined the impact of incremental changes in VMT on traffic congestion. Compared to the pre-pandemic levels:
- 5% VMT reduction: 40% congestion reduction.
- 10% VMT reduction: 66% congestion reduction.
- 20% VMT reduction: effectively eliminating congestion.
The analysis of corridor segments illustrated that some corridors experience lower traffic congestion until regional congestion reached relatively high levels. Others track regional congestion growth more closely and yet others may exceed levels of regional congestion. This exercise allowed researchers to categorize corridors as occasionally, frequently or usually congested. They also found a correlation between regional congestion and increased traffic volume on the identified signalized arterials.
“This was a unique opportunity to quantify the relationship between traffic volume and congestion, as well as characterizing specific corridors. It should provide MnDOT and its partners with a solid foundation from which to analyze strategies to reduce traffic demand,” said Paul Morris, project director, Transportation Policy and Studies, SRF Consulting Group.
Finally, researchers found that essential worker and environmental justice population travel times increased between five and 10 minutes as regional congestion neared the tipping point. Additionally, in the morning peak times, these groups’ travel times were disproportionately impacted by having to travel on the frequently congested freeway segments.
What’s Next?
This research found that a relatively small reduction in VMT has a large impact on regional congestion. This finding supports investments in travel demand management strategies as the first step for congestion reduction in the region. The results will inform efforts to achieve VMT reduction goals, including prioritizing corridors and strategies for reducing traffic and congestion.
