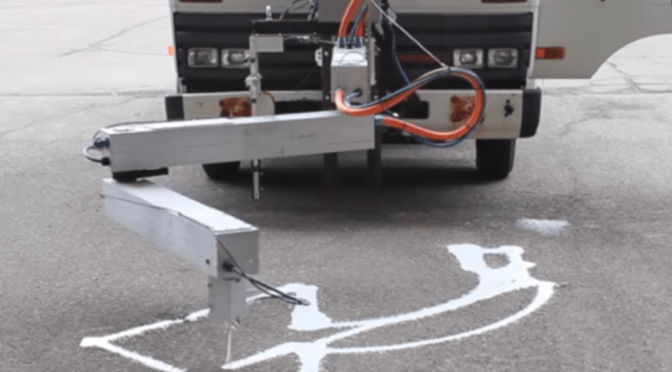
In the above video, University of Minnesota-Duluth Associate Professor Ryan Rosandich tests a prototype of a robotic arm he developed to paint messages and markings on roadways. He calls the machine “The MnDOT Robot.”
During a test run in October 2015, the MnDOT robot painted a right-turn arrow and the word “ahead” on pavement at MnDOT’s Pike Lake station in Duluth.
Rosandich hopes commercial companies will show an interest in further developing his proof-of-concept technology into something that road authorities can use regularly to make work easier, faster and safer for their employees.
Companies interested in commercializing this technology can contact Andrew Morrow at amorrow@umn.edu.
Editor’s Note: The paint used in the above demonstration was diluted due to the cold weather at the time of the demonstration and does not reflect the condition of the paint expected in a typical application.
While some interns spend their days making copies and coffee runs, Caitlin Johnson spent her summer internship working on a research project exploring ways to improve safety in work zones.
Johnson, a fifth-year civil engineering student, is one of eight undergrads from the University of Minnesota who participated in this year’s Summer Transportation Internship Program.
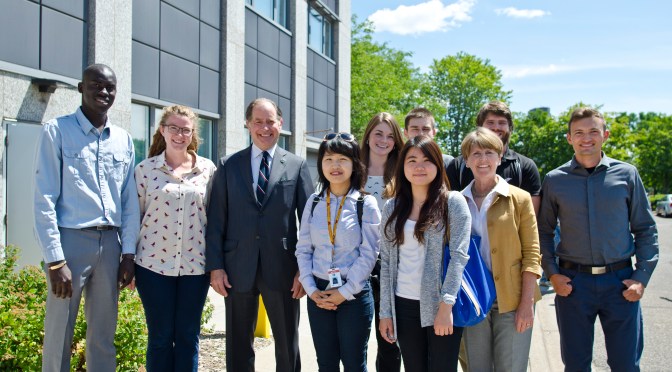
Interns worked at MnDOT for 10 weeks and gained valuable transportation-related experience in areas ranging from designing roadways to measuring pavement movement. The program, offered jointly by CTS and MnDOT, is now in its fourth year.
This year’s participants included the following students, working in these MnDOT offices:
Caitlin Johnson, Office of Traffic, Safety and Technology
Mamadou Mbengue, Office of Environmental Stewardship
Johnson says her internship at MnDOT gave her the opportunity to study a topic that hasn’t been explored in-depth in the past and present those findings to industry professionals, including staff from the Federal Highway Administration. Luke Horsager, a civil engineering senior, spent his internship with the Bridge & Hydraulics Office equipping MnDOT boats with new GPS and Bluetooth software used for river mapping and monitoring bridge scour. He says he enjoyed gaining hands-on experience with the technology.
Heidi Gray, a MnDOT Metro District designer who supervised intern Ellie Lee in the Office of Design, says the internship program is valuable not only for the students, but also for the supervisors and MnDOT as a whole. While the interns gained important hands-on work experience and made valuable professional connections, MnDOT supervisors were introduced to talented young professionals.
“It’s really good to get young people in here and teach them what MnDOT is all about,” Gray says. “I personally have enjoyed the opportunity to teach and pass along what I know. It’s a good refresher.”
Application materials for the 2016 Summer Transportation Internship Program will be available on the CTS website in early November.
Joint article produced with MnDOT Research Services
Minnesota developed the Strategic Highway Safety Plan a decade ago, as the nation set a goal of reducing roadway deaths to less than one person per 100 million vehicle miles traveled. Last year, the nation still hadn’t reached this milestone (1.1 deaths occurred per 100 million miles), but Minnesota had lowered its fatality rate to 0.63 deaths (down from 1.48 deaths from 20 years ago).
“When I look at what Minnesota has done over the last 15 years compared to other states, we’re one of the few states that has a pretty consistent downward trend [in fatal crashes],” said Brad Estochen, MnDOT state traffic engineer, who gave an update on the highway safety plan during a recent presentation at the Roadway Safety Institute. “I think we’re doing some unique things here that have given us these results.”
These steps, Estochen says, have included passing a primary offense seatbelt law (seatbelt usage is now above 90 percent), investing in strategic safety infrastructure like high-tension cable median barriers and focused enforcement of DWI, speed and seatbelt laws.
Developing a plan
To best understand the risk factors for fatal and serious injury crashes, the state combined real-life crash data with input from professionals in engineering, law enforcement, emergency medical services, as well as everyday road users. The results showed that most crashes in the state involve multiple factors—such as road conditions, driver impairment and driver age.
Estochen said this approach of analyzing data and gaining stakeholder perspectives provided new insights into the dynamic causes of fatal and serious injury crashes.
In conjunction with the Departments of Health and Public Safety, MnDOT created a highway safety plan aimed at both professional stakeholders and the community that identified critical strategies for reducing serious traffic incidents. It has been updated in 2007 and 2014, most recently.
MnDOT also created a complimentary document for every county and MnDOT district (respectively called the county safety plan and district safety plan) to help local agencies identify locations and potential projects for reducing fatalities.
“We were the first state to take the SHSP concept to the local level. It was identified as a noteworthy practice by FHWA and other states are now starting to engage locals in developing specific plans for their use and implementation,” Estochen said.
The highway safety plan is an integral part of Toward Zero Deaths, the state’s cornerstone traffic safety program that has a goal of reducing fatalities to less than 300 per year by 2020.
Overall, Estochen said one of the best ways to reduce crashes in the state is to promote a culture of traffic safety — something he hopes the highway safety plan contributes to.
“Creating a traffic safety culture has nothing to do with building bigger and better roads,” he said. “It really has to do with making us as a state, as a community and as individuals responsible for our actions.”
In July, CTS introduced the next generation of the workforce to transportation topics and careers during a two-week summer program. Thirty students entering seventh through ninth grade attended the CTS-hosted National Summer Transportation Institute, where they got hands-on experience with topics ranging from distracted driving to aeronautics to traffic management.
As part of the program, attendees toured campus, visited the U of M’s transportation-related labs, and learned tips on researching, studying, public speaking, and writing. In addition, participants learned about many aspects of transportation, including human factors, roadway safety, bridge design, surveying, and traffic simulation.
This slideshow requires JavaScript.
The camp also included outings to several MnDOT facilities, UPS, Metro Transit, the Minneapolis–St. Paul International Airport, the Minnesota Transportation Museum, and boat tours of the St. Croix River Crossing construction site and St. Paul Port Authority.
Highlights for attendees included riding the light rail and going behind the scenes in a Metro Transit control room, watching airplanes take off and exploring maintenance equipment at the airport, getting up close to bridge construction on the St. Croix River Crossing boat tour, and using a driving simulator to learn about distracted driving at UPS.
“I really enjoyed using the driving simulators,” said one of the ninth-grade program participants. “It was a hands-on experience that truly taught me the dangers of texting while driving and how much harder it really is.”
In post-program evaluations, parents reported that their children had learned valuable information about transportation topics, careers, and related education opportunities.
“This was one of the best camps we have ever experienced,” one parent said. “There was always a plan for college, and this program increased enthusiasm, preparedness, and maturity.”
“[The program] opened up my daughter’s horizon for future career choices and major focus areas after high school,” another parent said.
The program was sponsored by CTS with funding from the Federal Highway Administration administered by the Minnesota Department of Transportation (MnDOT).
A handful of county highway department employees in the Rochester area gathered recently at the Olmsted County Public Works Service Center for a presentation and live demonstration by University of Minnesota Research Fellow Brian Davis about his team’s work involving light detection and ranging – or LiDAR.
“LiDAR is like radar, but with light,” Davis said. “It gives you information about what’s around the sensor.”
Event attendees gather around a sedan outfitted with a spinning LiDAR sensor. (Photo by Micheal Foley, MnDOT)
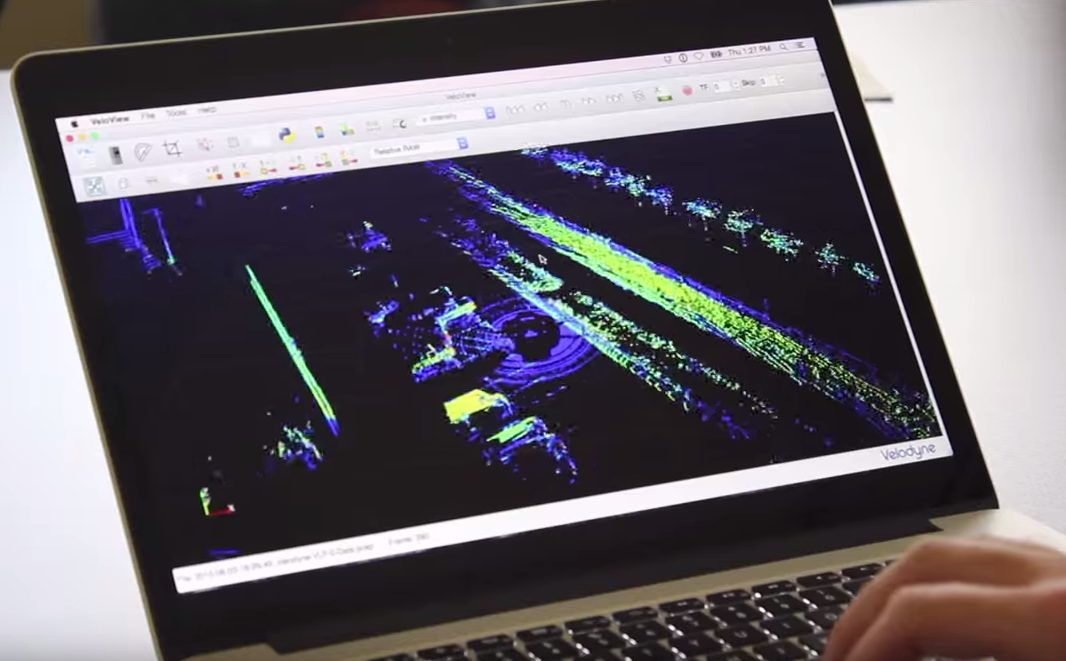
Davis and his fellow researchers have outfitted a sedan with special LiDAR equipment and other technology that is capable of capturing a 360-degree, 3-D view of a scene in real time.
“We use the car as a test bed,” Davis said. “We have a lot of different types of sensors on the car that we use for the different projects that we’re working on. Right now we have a LiDAR sensor on top. Sometimes we have a high-accuracy GPS receiver in there. We have a cellular modem. We have a handful of inertial sensors. So it’s a lot of different stuff that we use to cater to the application.”
For his presentation, Davis showed the attendees some of the data his team had already collected.
Davis presents data that shows the LiDAR-equipped sedan moving along a roadway. (Photo by Micheal Foley, MnDOT)
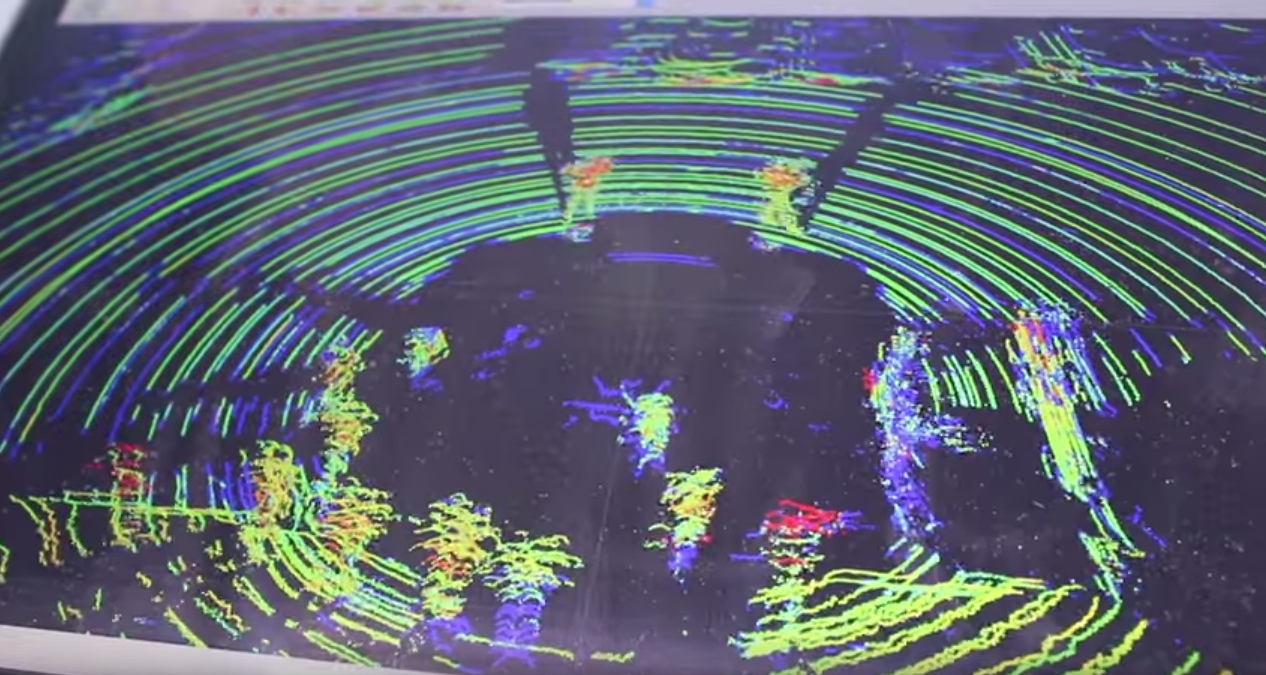
“We showed a handful of pre-collected data at a handful of intersections around Rochester and Minneapolis,” Davis said. “What it shows is the point cloud collected by the sensor – just the raw point cloud with no post-processing done. In that information you can see people moving through it, cars moving through it, buses and light rail trains.”
Event attendees move around the sedan to see how the LiDAR sensor views them. (Photo by Micheal Foley, MnDOT)
After the presentation, Davis led the group to the parking lot for a close-up look at the technology and how it collects data and displays that data in real time. Le Sueur County GIS manager Justin Lutterman was among those who could envision possible applications for LiDAR.
“It’ll be interesting to see where this can go,” Lutterman said. “I’m sure the private industry will take off with this and emergency management, or the sheriffs and ambulances, would appreciate this kind of technology on their vehicles for a situation they might have to recreate. Roads and traffic designers would be able to monitor their resources, pavements, traffic counts and things like that.”
Over the coming months, researchers will gather more data to develop a workshop for county personnel interested in learning more about LiDAR and how it can be applied in their transportation systems.
“The next steps for this project are to collect some data with the car at intersections. Then we can use that information to fine tune our algorithms,” Davis said. “What the algorithms are going to do is take that raw data and give us useful information, like the number of cars, or the time a car passes through an intersection. That all feeds into the workshop we’re developing. The workshop is going to be for county GIS workers, traffic engineers and county engineers who are interested in learning about these technologies.”
Motorists are experiencing less delay on metro-area highways, thanks to major changes to the Twin Cities’ ramp metering system.
The Minnesota Department of Transportation has reconfigured ramp meters to be more in sync with real conditions. With changes to the turn-on and turn-off criteria, the meters are actually running for a shorter period of time and are only activated when needed.
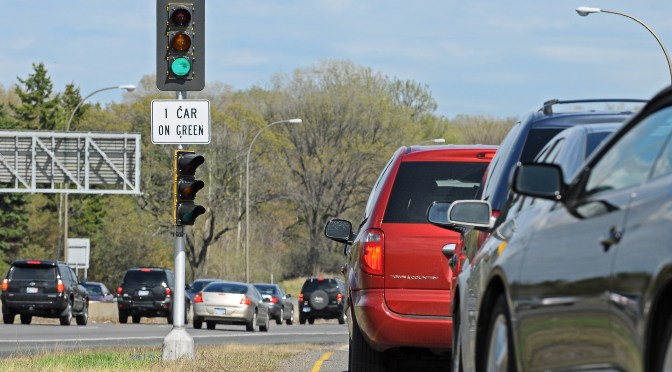
Ramp meters are traffic lights placed on freeway entrance ramps that control the frequency that vehicles can enter the highway. Sensors embedded in the pavement collect the vehicle traffic data used to time approximately 440 ramp meters.
Staff at the Regional Transportation Management Center, which manages the ramp meters, say the whole system is operating better because of changes that were implemented approximately one year ago (based off a 2012 study).
University of Minnesota-Duluth professor Eil Kwon developed the system’s new software algorithms. In a case study of Highway 100, he found that the delay on the mainline dropped by nearly half.
On northbound Highway 100, the amount of “delayed vehicle hours” — defined as the vehicle hours of traffic flow with speeds less than 45 mph — that motorists experienced dropped 48 percent during the months of October and November in 2012 when compared to the same period in 2011. During the same time period, total volume on that section of northbound Highway 100 increased by 2.7 percent, Kwon said. In spring 2013, the amount of delayed vehicle hours had been reduced by 17 percent.
These results are preliminary, as additional analysis is needed to determine if these results are typical throughout the system on other freeway corridors. However, based on a personal savings of $16.50 per hour, the scenario described above represents a cost savings to motorists of $1,353 to $3,447 per day (depending on the season). That’s as much as $339,150 to $861,640 per year for just a six-mile stretch of highway.
More efficient
Under the old system, each ramp meter would turn on based on current traffic conditions, but the criteria to turn on were easily met, causing the meters to turn on too soon. The old system did not have turn-off criteria, allowing meters to run until a pre-set time of day.
With the new system, improvements were made to make the meters respond more appropriately to current traffic conditions. The turn-on criteria were improved so that meters come on only when needed, and turn-off criteria were added, allowing meters to turn off when traffic conditions improved.
The new metering system is particularly effective at reducing the number of meters operating on light traffic days.
“On days like the ones leading up to Thanksgiving, where traffic may be 10-to-15 percent less than normal, instead of, say, 150 ramp meters being on at a particular time, now maybe only 50 ramp meters will be operating,” explained MnDOT Freeway System Operations Engineer Jesse Larson.
Upgrades to the ramp metering system also allow for a better picture of what traffic is like at a given moment, because it’s now based on corridor density rather than traffic flow.
Traffic flow is the measurement of the number of vehicles passing a given point. Using traffic flow was flawed, in that similar traffic flows can occur at different speeds. The old system couldn’t differentiate between 1,000 cars passing by at 20 miles per hour versus 1,000 cars passing at 60 miles per hour, for example.
Corridor density, on the other hand, is the number of vehicles per lane per mile. By measuring density instead of traffic flow, the system has a more accurate picture of what current conditions are like on the freeway.
Another bonus: ramp meters will no longer release a bunch of cars simultaneously once an entrance ramp fills up. That’s because the system can now detect the ramp filling up and release the extra cars gradually instead.
Twin Cities ramp meters now turn on and off based on live traffic conditions.
In the search for a quieter rumble strip, Minnesota may have found a winner in California.
California’s standard rumble strip design outperformed Minnesota’s and Pennsylvania’s in a comparison study along a rural highway near Crookston, Minnesota. (Read the recently published report.)
“California’s rumble strip still gave significant feedback to drivers, but it was significantly less noticeable outside the vehicle,” said engineering consultant Ed Terhaar, who performed a noise analysis with acoustical engineer David Braslau on behalf of the Minnesota Local Road Research Board.
A California-style sinusoidal rumble strip, installed along a Polk County Highway.
Although they serve as an effective warning to drivers, rumble strips can cause unwanted noise when a vehicle drifts over a centerline or edgeline.
Both the LRRB and the Minnesota Department of Transportation, which is sponsoring a companion study, are interested in finding a new design that still captures the driver’s attention, but minimizes the sound heard by neighboring residents.
Polk County tests
Terhaar and Braslau’s research showed that Minnesota and California’s designs produce a similar level of interior noise. Although external decibel levels are not that different from each other either, Minnesota’s rumble strip has a considerably stronger tone that can be heard further away.
“California’s sound is less sharp, less intrusive and less noticeable,” Braslau said. “Minnesota’s has a really sharp peak. So while the absolute sound level of California’s isn’t all that much lower, its perception is less.”
Testing was performed using three different vehicles – a passenger car, pickup truck and semi-trailer truck – at three different speeds – 30, 45 and 60 miles per hour.
In general, Pennsylvania’s rumble strip had both a quieter interior and exterior sound than California’s and Minnesota’s.
Like Pennsylvania, California’s rumble strip has what is called a sinusoidal design – a continuous wave pattern that’s ground into the pavement (it’s the style commonly used in Europe and has been called a “mumble strip” because it’s quieter). The main difference between the two is that California’s wave length is 14 inches, while Pennsylvania’s is 24 inches.
Minnesota’s design is much different than the sinusoidal pattern used by the other two states.
“It’s not a continuous wave – it’s basically chunks of pavement taken out at certain intervals with flat pavement in between. It’s more of an abrupt design, whereas California and Pennsylvania’s are more continuous and smooth,” Terhaar explained.
The next step for researchers is to test variations of the California rumble strip design at MnDOT’s Road Research Facility (MnROAD).
The 8-inch rumble strip tested in Crookston is the typical edgeline design used by Polk County, but it was found to be too narrow for semi tires, so MnDOT will look at wider designs in its follow-up study. Researchers will also look at the impacts to motorcyclists and bicyclists, as well as the California rumble strip’s centerline striping capability.
The Minnesota rumble strip, at left and also pictured in top photo, and California rumble strip, right.
The Minnesota Department of Transportation is testing a crowdsourcing application that will allow motorists to update winter weather road conditions on the state’s 511 system.
The Regional Transportation Management Center is planning a soft launch of Citizen Reporting in April, initially inviting MnDOT employees to post their experiences on routes they travel. By next winter, the RTMC hopes to invite the public to do the same.
“We suspect that citizen reporters will be similar in ethic to the kinds of people who volunteer to be weather spotters,” said MnDOT Transportation Program Specialist Mary Meinert, who assists with day-to-day operations of 511.
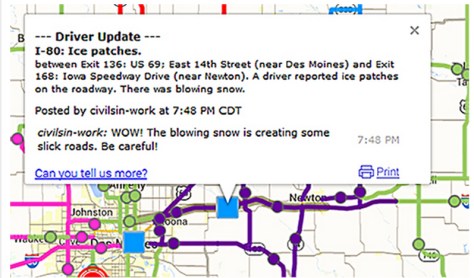
Iowa launched Citizen Reporting in November. Here is an example of a citizen report.
Currently, MnDOT maintenance crews report road conditions, but Greater Minnesota lacks 24/7 coverage and its reports can become quickly outdated, especially on highways that aren’t plowed as frequently or lack traffic cameras, said 511 System Coordinator Kelly Kennedy Braunig.
Citizen reporting, especially on weekends, will help keep that information fresh.
“We try to explain on the website that we only update from 3–6 a.m., 3–6 p.m. Monday through Friday and as road conditions change, but we still get many emails requesting more frequent road condition information,” Braunig said.
Even a recent comment on MnDOT’s Facebook page pointed out the limitations in one area of the state: “Updates [only] come during government work hours.”
Growing Service
It’s actually a welcome sign that the public wants more from 511.
Seven years ago, when Braunig applied for her job, not many people used 511. In fact, at the time, she wasn’t even aware of the service, which provides information to travelers on weather-related road conditions, construction and congestion.
Today, 511’s online program and mobile app are accessed by more than 5,000 people per day during the winter (and about half as many during the summer). Data comes from MnDOT’s construction and maintenance offices, as well as state trooper data and incident response. This real-time information is available for all of Minnesota.
In the Twin Cities metro area, more than 700 traffic cameras allow MnDOT and State Patrol dispatchers to check the condition of 170 miles of highways and monitor traffic incidents at any time. Rochester, Duluth, Mankato and Owatonna also have cameras for incident management and traffic monitoring.
The 511 system’s greatest challenge is in Greater Minnesota, where road condition information is used daily by schools, ambulance personnel and truckers, as well as the traveling public, but information isn’t updated frequently outside of business hours. Citizen reporting will be a beneficial resource.
Other states
Other northern states face similar challenges as Minnesota, but have been able to improve the timeliness of road condition data with assistance from truckers and other motorists.
In Wyoming, more than 400 citizen reporters (primarily truckers) call in road conditions to the Transportation Management Center. In Idaho, citizen reporters directly put the information into the 511 system. Minnesota will be the fifth state to adopt citizen reporting, following Iowa, which launched its service in November 2014.
Like Iowa, Minnesota’s citizen reporting will initially focus on winter roads.
To participate, people will need to take an online training module and then register their common routes, perhaps the highways they take to work or their way to the cabin on the weekends. These contributions will be marked as a citizen report on the website.
“Minnesota truck drivers are loyal users of the 511 system and we suspect they will also make some of our best reporters,” Meinert said.
Minnesota is part of a 13-state consortium that shares a 511 service technology provider. States with citizen reporting recently shared their experiences in a Peer Exchange sponsored by North/West Passage, a transportation pooled fund that is developing ways to share 511 data across state lines.
“With citizen reporting we hope to give people a voice and a chance to participate,” Braunig said.
Your drive home may be a few minutes quicker today thanks to a team of researchers who are making it easier for Minnesota engineers to retime traffic signals.
It normally costs $3,500 to retime a signal due to the time involved in collecting the data and optimizing timings. But over the past several years, MnDOT-funded research has helped develop the SMART Signal system, which not only collects traffic and signal-phase data automatically, but also identifies under-performing traffic signals and generates optimal signal timing plans with minimal human intervention.
Traffic delays typically grow 3 to 5 percent per year due to outdated signal timing; however, most traffic signals in the United States are only re-timed every two to five years (or longer).
“Large-scale deployment of the SMART Signal system will significantly change the state-of-the-practice on signal re-timing because MnDOT won’t have to retime a traffic signal based on a fixed schedule,” said University of Michigan researcher Henry Liu (formerly a University of Minnesota professor), who began developing the system in the mid-2000s. “Instead, because of the reduced cost of signal data collection and performance measurement, signal retiming becomes performance-driven rather than schedule-based.”
MnDOT (along with many cities and counties) embeds loop detectors in road pavements that notify a traffic signal that a vehicle is present. Staff normally must manually track wait times to determine how the signal timing is affecting traffic.
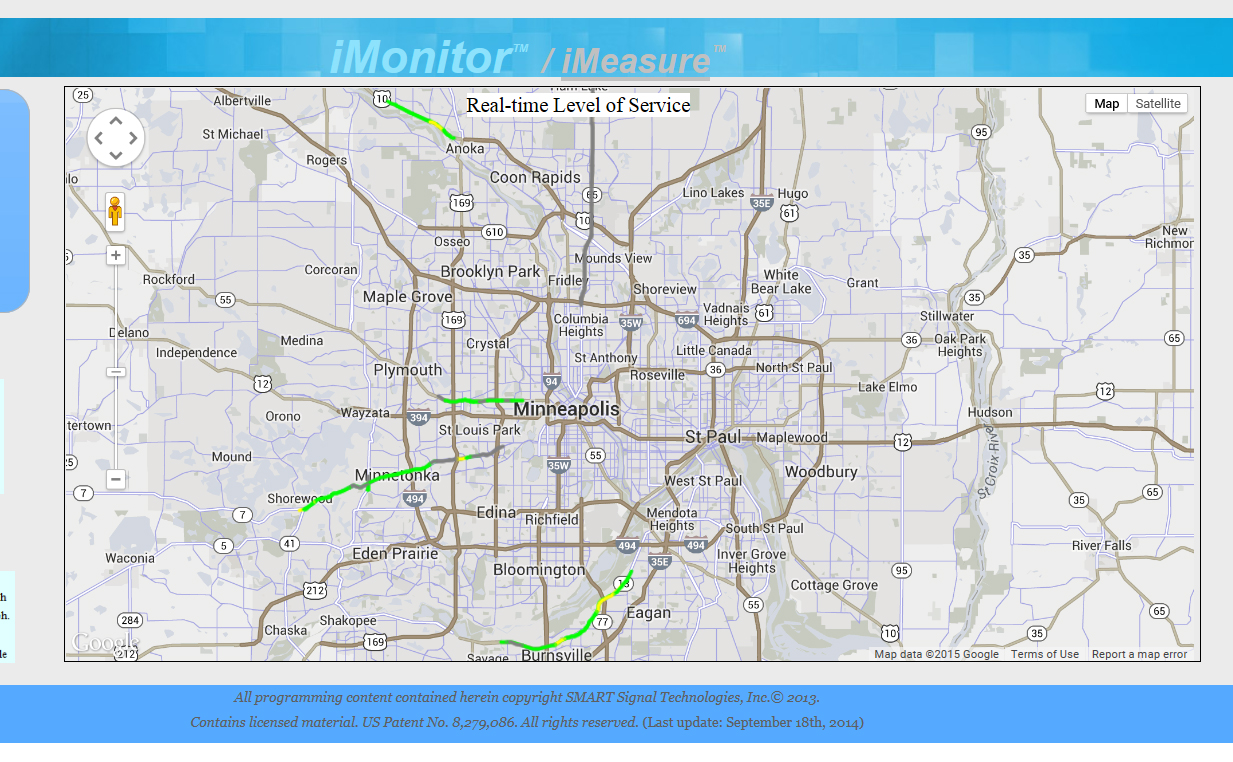
But SMART Signal automates much of this process by recording how long a vehicle waits at an intersection and automatically reporting the data (along with signal timing) to a central server. The data — viewable in real-time on this website — can then be analyzed to determine traffic patterns and optimal signal timing.
Recent enhancements to the SMART Signal system were successfully tested on Highway 13 in Burnsville, reducing vehicle delay there by 5 percent. The benefit could be in the double digits for corridors with worse traffic delays.
SMART Signal — which stands for Systemic Monitoring of Arterial Road Traffic — has been installed at more than 100 Minnesota intersections and is currently in the process of commercialization.
The latest research optimizes the system’s ability to reduce traffic delays by developing a framework to diagnose problems that cause delays at traffic signals and an algorithm that automatically optimizes the signal plan to address these problems. The software upgrade has since been integrated into all SMART Signal intersections.
Across the country, the financial benefit of retiming signals has been shown to be tremendous. On San Jose Boulevard in Jacksonville, Florida, for instance, traffic delays in one corridor dropped 35 percent and resulted in an annual estimated fuel savings of $2.5 million.*
“Data collection and performance monitoring are critical for improving traffic signal operations, and yet before the development of the SMART Signal system, these tasks were prohibitively expensive for most agencies because of the number of signals involved,” Liu said.
Future Applications
Liu is also looking at other potential applications for SMART Signal :
Improving safety at intersections with unusually high crash rates and predicting which intersections are likely to have elevated crash rates in the future.
Developing traffic signal timing models for diverging diamond intersections.
Determining how traffic and vehicle routes are affected by construction lane closures and detours on signalized highways.
A real-time adaptive signal control, which would automatically adjust signal timings based on current conditions, is not currently feasible with the SMART Signal system because it would require additional vehicle sensors. The latest SMART Signal research does, however, automate the data collection and calculations that would help the development of such a system.
A data collection unit collects event-based traffic and signal data and sends it to a remote center for analysis.
*The Benefits of Retiming Signals,” ITE Journal, April 2004
Note: This blog post was adapted from an article in the latest issue of our newsletter, Accelerator. Click here to subscribe.
In recent years, the transportation community has introduced significant changes to improve left-turn safety at signalized intersections—and for good reason. Nationally, intersection crashes represent one-fifth of all fatal crashes, and most of these are crashes involving left turns.
In response to this serious safety problem, the FHWA has adopted a new national standard for permissive left turns: the flashing yellow arrow. This signal warns drivers that they should proceed with a left turn only after yielding to any oncoming traffic or pedestrians. Flashing yellow arrow signals can help prevent crashes, move more traffic through an intersection, and provide additional traffic management flexibility.
Many transportation agencies, including MnDOT, are interested in using the new flashing yellow arrow signals to accommodate within-day changes: protected left turns (signaled by a green arrow) could be used when needed to lower crash risk, while permitted left turns (signaled by a flashing yellow arrow) could be used to reduce delay when crash risk is low.
“Of course, this requires being able to predict how the risk of left-turn crashes changes as intersection and traffic characteristics change within the course of a day,” says Gary Davis, a professor of civil, environmental, and geo- engineering at the University of Minnesota.
To help engineers make more informed decisions about when to use flashing yellow arrows, Davis is leading the development of a model that could help predict the probability of left-turn crash risk at a given intersection at different times of day. This model—which will ultimately be available as a set of spreadsheet tools—will help traffic engineers determine when the crash risk is sufficiently low to allow for the safe use of flashing yellow arrows. The project is sponsored by MnDOT and the Minnesota Local Road Research Board.
To develop the statistical model, the researchers needed to determine how the risk for left-turn crashes varies depending on time of day, traffic flow conditions, and intersection features (such as number of opposing lanes, number of left-turn lanes, and median size). The process included developing a database containing left-turn crash information, intersection features, and traffic volumes, as well as developing a set of 24-hour traffic pattern estimates to help fill gaps where hourly traffic volume counts were not available. The resulting statistical model uses this information to determine relative crash risk for every hour of the day at a given type of intersection.
Currently, Davis and his team are using the model to develop a spreadsheet tool that will allow traffic engineers to choose their type of intersection and enter the available turning movement count. The tool will then generate a specialized graph for that intersection showing the relative crash risk by time of day. Any time the crash risk is at or below the level identified as acceptable, engineers can consider using flashing yellow arrows.
“By simulating how crash risk changes as traffic conditions change, this model could help identify conditions when permitted left-turn treatments would be a good choice and what times of day a protected left turn might be a better option,” Davis says.
Moving forward, Davis is leading an additional project related to the use of flashing yellow arrows, funded by the Roadway Safety Institute. The project will first review video data of drivers making permitted left turns to characterize left-turn gap acceptance and turning trajectories. Then, Davis will incorporate the findings into the existing statistical model. To further improve the model’s accuracy, the study will compare the crashes described by the simulation model with reconstructed real-world left-turn crashes.