

Intersections can be controlled through pretimed systems or vehicle-actuated systems, which detect the presence of a vehicle. Good vehicle detection is the foundation of actuated systems. While loop detectors have been effective workhorses of vehicle detection for MnDOT, changes in vehicle fleets—for example, the use of nonferrous materials—and an increased need to detect vulnerable road users has resulted in an increased use of nonintrusive detection technologies (NIT).
Continue reading New Project: Performance Evaluation of Detection Technologies for Signalized Intersections in MinnesotaTag Archives: intersections

Design Standards for Unobstructed Sight Lines at Left-Turn Lanes
Positive offset left-turn lanes are one solution to improving left-turning motorists’ visibility of opposing through and right-turning traffic.
MnDOT is revising its Road Design Manual and seeks to incorporate more information, policies and design guidance regarding positive offset left-turn lanes.
Researchers from the University of Wisconsin’s Traffic Operations and Safety Laboratory reviewed safety performance data from research that examined left-turn offsets. They also consulted 23 state DOT road design guides to understand the extent of available guidance.
Continue reading Design Standards for Unobstructed Sight Lines at Left-Turn Lanes
Using SMART-Signal Data to Predict Red Light Running at Intersections
This project developed a methodology using traffic data collected by the SMART-Signal system to identify intersections prone to red light running and, therefore, serious crashes. This methodology could help MnDOT prioritize intersections for safety improvements.
“The essence of this project was to develop a toolbox that traffic engineers can use to determine an intersection’s safety performance,” said Henry Liu, Research Professor, University of Michigan Transportation Research Institute.
Liu served as the study’s principal investigator.
“This research provides a way to classify intersections that have a higher potential for red light running,” Mick Rakauskas, Former Research Fellow, HumanFIRST Program, University of Minnesota
What Was the Need?
Engineers traditionally measure an intersection’s safety using the number of crashes that actually occur there. However, collisions are rare and somewhat random events, and it can take a long time to collect enough data to accurately assess a single location’s safety.
Traffic conflicts—“close calls” in which one or both drivers must brake, swerve or take some other evasive action to avoid a crash—happen much more often than collisions do. As a result, many research projects use traffic conflicts as an alternative measure of safety.
Red light running (RLR) is one of the most common and dangerous causes of traffic conflicts at signalized intersections. While not every RLR event leads to a collision, it is often the first step in a process that ends in one.
Additionally, crashes caused when drivers run red lights are typically right-angle crashes, which are frequently severe. About 45 percent of right-angle collisions result in injury compared to about 25 percent of other crash types. Reducing right-angle-crash frequency can therefore significantly improve overall road safety and reduce costs related to traffic collisions.
MnDOT’s Safety Group wanted to determine whether it was possible to objectively and automatically identify intersections where RLR events are most likely to occur. Developing a methodology to identify the most dangerous intersections would help MnDOT prioritize locations for safety improvements.
What Was Our Goal?
Several previous MnDOT research projects had developed the SMART-Signal system, an automatic system that collects data from traffic signal controllers at signalized intersections. MnDOT has installed the system at more than 100 intersections in the Twin Cities. This project sought to develop tools that use SMART-Signal data to evaluate safety performance at intersections.
What Did We Do?

Researchers analyzed SMART-Signal data collected at the intersection of Boone Avenue and Trunk Highway 55 (TH 55) in Golden Valley between December 2008 and September 2009. This intersection is equipped with both stop-bar detectors and advance detectors located about 400 feet upstream of the intersection. Researchers used stop-bar-actuation data and details about traffic signal phases to identify RLR events at the intersection.
However, since most intersections are equipped only with advance detectors, this method cannot be used to measure RLR events at all intersections. As an alternative, re-searchers used vehicle-speed and traffic-volume data from the advance detectors, along with recorded traffic-signal-phase information from SMART-Signal, to identify potential RLR events. They compared these potential events to actual RLR events identified using stop-bar data and developed a formula to predict whether an RLR event would occur. This formula can be applied at intersections of major and minor roads that are not equipped with stop-bar detectors.
Researchers then used data from a minor road to develop a method that identified whether an RLR event would lead to a traffic conflict. In this method, an intersection is first divided into four conflict zones (two in each direction). When a vehicle from the main road enters the intersection, the method enables researchers to calculate when the vehicle enters and leaves each of the conflict zones it passes through. Then they determine whether a vehicle from the minor road is in the same conflict zone. Using this methodology, researchers estimated the number of daily traffic conflicts at other inter-sections on TH 55. These estimates were based on data collected in 2009 and between 2012 and 2015.
Finally, researchers developed a regression model to evaluate whether adding the number of predicted traffic conflicts to a more standard model that used average annual daily traffic (AADT) would correlate with the number of actual collisions at that site. They evaluated the model using data from seven four-legged intersections and two T-intersections on TH 13 and TH 55.
What Did We Learn?
The formula for predicting RLR events matched observations 83.12% of the time, based on more than 2,000 data points.
The number of daily crossing conflicts at TH 55 intersections ranged from 7.9 (at Glenwood Avenue in 2009) to 51.2 (at Winnetka Avenue in 2013).
While limited data were available for the regression model (as no site had more than four years of SMART-Signal data available, and there were only 11 crashes in total), the model suggests that estimated average traffic conflicts and minor-road AADT both contribute to accurate prediction of right-angle-crash frequency, while major-road AADT does not. Due to the limited data available, however, these conclusions should be considered preliminary.
What’s Next?
While there are currently no plans for follow-up studies, additional research efforts could include continuing to evaluate and improve the prediction model as more data are collected, and installing video cameras at intersections to validate the proposed methodologies.
This Technical Summary pertains to Report 2017-08, “Estimation of Crossing Conflict at Signalized Intersection Using High-Resolution Traffic Data,” published March 2017.

Making SMART Signals even smarter
Your drive home may be a few minutes quicker today thanks to a team of researchers who are making it easier for Minnesota engineers to retime traffic signals.
It normally costs $3,500 to retime a signal due to the time involved in collecting the data and optimizing timings. But over the past several years, MnDOT-funded research has helped develop the SMART Signal system, which not only collects traffic and signal-phase data automatically, but also identifies under-performing traffic signals and generates optimal signal timing plans with minimal human intervention.
Traffic delays typically grow 3 to 5 percent per year due to outdated signal timing; however, most traffic signals in the United States are only re-timed every two to five years (or longer).
“Large-scale deployment of the SMART Signal system will significantly change the state-of-the-practice on signal re-timing because MnDOT won’t have to retime a traffic signal based on a fixed schedule,” said University of Michigan researcher Henry Liu (formerly a University of Minnesota professor), who began developing the system in the mid-2000s. “Instead, because of the reduced cost of signal data collection and performance measurement, signal retiming becomes performance-driven rather than schedule-based.”
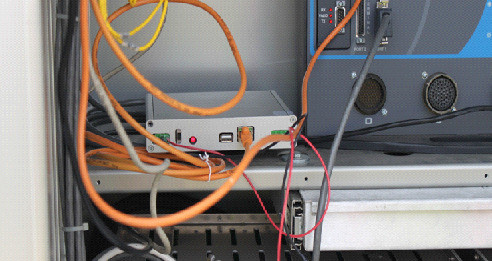
MnDOT (along with many cities and counties) embeds loop detectors in road pavements that notify a traffic signal that a vehicle is present. Staff normally must manually track wait times to determine how the signal timing is affecting traffic.
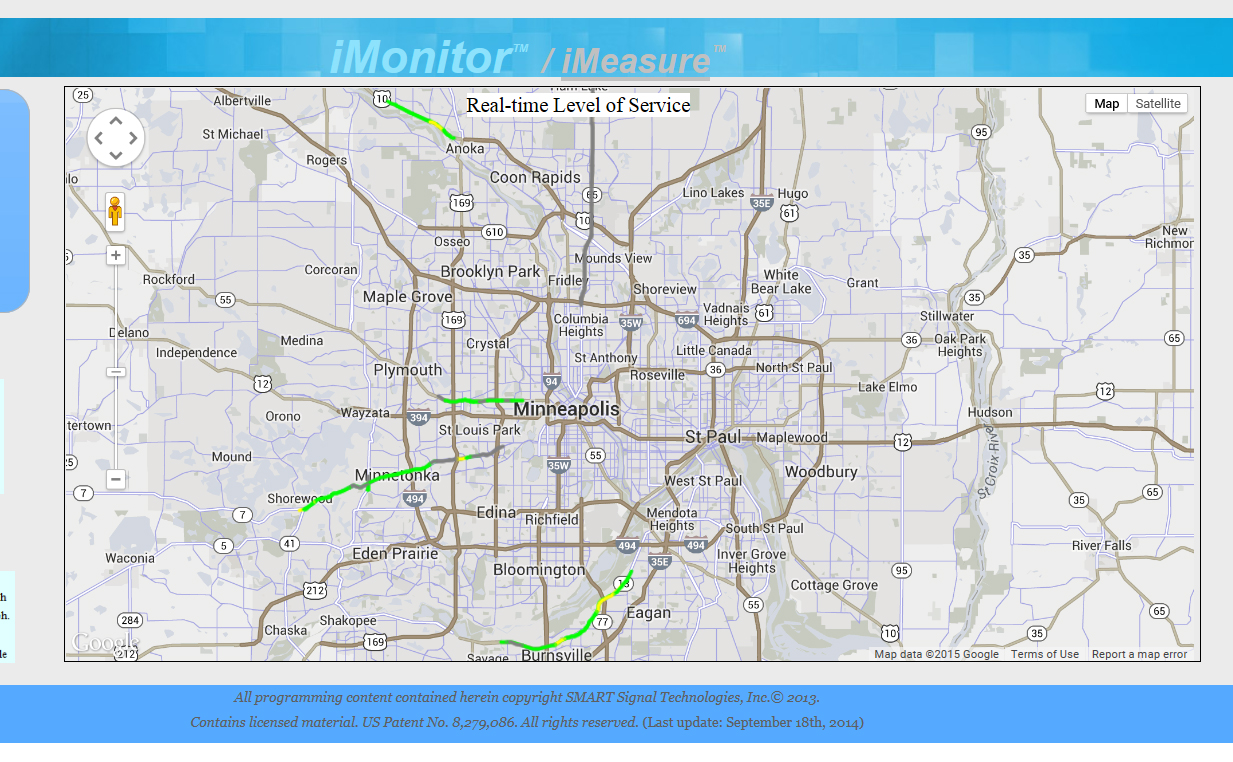
But SMART Signal automates much of this process by recording how long a vehicle waits at an intersection and automatically reporting the data (along with signal timing) to a central server. The data — viewable in real-time on this website — can then be analyzed to determine traffic patterns and optimal signal timing.
Recent enhancements to the SMART Signal system were successfully tested on Highway 13 in Burnsville, reducing vehicle delay there by 5 percent. The benefit could be in the double digits for corridors with worse traffic delays.
SMART Signal — which stands for Systemic Monitoring of Arterial Road Traffic — has been installed at more than 100 Minnesota intersections and is currently in the process of commercialization.
The latest research optimizes the system’s ability to reduce traffic delays by developing a framework to diagnose problems that cause delays at traffic signals and an algorithm that automatically optimizes the signal plan to address these problems. The software upgrade has since been integrated into all SMART Signal intersections.
Across the country, the financial benefit of retiming signals has been shown to be tremendous. On San Jose Boulevard in Jacksonville, Florida, for instance, traffic delays in one corridor dropped 35 percent and resulted in an annual estimated fuel savings of $2.5 million.*
“Data collection and performance monitoring are critical for improving traffic signal operations, and yet before the development of the SMART Signal system, these tasks were prohibitively expensive for most agencies because of the number of signals involved,” Liu said.
Future Applications
Liu is also looking at other potential applications for SMART Signal :
- Improving safety at intersections with unusually high crash rates and predicting which intersections are likely to have elevated crash rates in the future.
- Developing traffic signal timing models for diverging diamond intersections.
- Determining how traffic and vehicle routes are affected by construction lane closures and detours on signalized highways.
A real-time adaptive signal control, which would automatically adjust signal timings based on current conditions, is not currently feasible with the SMART Signal system because it would require additional vehicle sensors. The latest SMART Signal research does, however, automate the data collection and calculations that would help the development of such a system.
*The Benefits of Retiming Signals,” ITE Journal, April 2004
Note: This blog post was adapted from an article in the latest issue of our newsletter, Accelerator. Click here to subscribe.
Related Resources
Research Project: Automatic Generation of Traffic Signal Timing Plan (2015)
(Development of the SMART-SIGNAL system began with Real-Time Arterial Performance Monitoring System Using Traffic Data Available from Existing Signal Systems (2009). It continued with Research Implementation of the SMART SIGNAL System on Highway 13 (2013) , which refined the system and its user interface, and Improving Traffic Signal Operations for Integrated Corridor Management (2013), which developed data-based strategies for relieving congestion by adjusting signal timings.)

New permitted left-turn model helps improve intersection safety
In recent years, the transportation community has introduced significant changes to improve left-turn safety at signalized intersections—and for good reason. Nationally, intersection crashes represent one-fifth of all fatal crashes, and most of these are crashes involving left turns.
In response to this serious safety problem, the FHWA has adopted a new national standard for permissive left turns: the flashing yellow arrow. This signal warns drivers that they should proceed with a left turn only after yielding to any oncoming traffic or pedestrians. Flashing yellow arrow signals can help prevent crashes, move more traffic through an intersection, and provide additional traffic management flexibility.
Many transportation agencies, including MnDOT, are interested in using the new flashing yellow arrow signals to accommodate within-day changes: protected left turns (signaled by a green arrow) could be used when needed to lower crash risk, while permitted left turns (signaled by a flashing yellow arrow) could be used to reduce delay when crash risk is low.
“Of course, this requires being able to predict how the risk of left-turn crashes changes as intersection and traffic characteristics change within the course of a day,” says Gary Davis, a professor of civil, environmental, and geo- engineering at the University of Minnesota.
To help engineers make more informed decisions about when to use flashing yellow arrows, Davis is leading the development of a model that could help predict the probability of left-turn crash risk at a given intersection at different times of day. This model—which will ultimately be available as a set of spreadsheet tools—will help traffic engineers determine when the crash risk is sufficiently low to allow for the safe use of flashing yellow arrows. The project is sponsored by MnDOT and the Minnesota Local Road Research Board.
To develop the statistical model, the researchers needed to determine how the risk for left-turn crashes varies depending on time of day, traffic flow conditions, and intersection features (such as number of opposing lanes, number of left-turn lanes, and median size). The process included developing a database containing left-turn crash information, intersection features, and traffic volumes, as well as developing a set of 24-hour traffic pattern estimates to help fill gaps where hourly traffic volume counts were not available. The resulting statistical model uses this information to determine relative crash risk for every hour of the day at a given type of intersection.
Currently, Davis and his team are using the model to develop a spreadsheet tool that will allow traffic engineers to choose their type of intersection and enter the available turning movement count. The tool will then generate a specialized graph for that intersection showing the relative crash risk by time of day. Any time the crash risk is at or below the level identified as acceptable, engineers can consider using flashing yellow arrows.
“By simulating how crash risk changes as traffic conditions change, this model could help identify conditions when permitted left-turn treatments would be a good choice and what times of day a protected left turn might be a better option,” Davis says.
Moving forward, Davis is leading an additional project related to the use of flashing yellow arrows, funded by the Roadway Safety Institute. The project will first review video data of drivers making permitted left turns to characterize left-turn gap acceptance and turning trajectories. Then, Davis will incorporate the findings into the existing statistical model. To further improve the model’s accuracy, the study will compare the crashes described by the simulation model with reconstructed real-world left-turn crashes.

New technology aimed at making rural intersections safer
This video above showcases a new kind of intersection conflict warning system being developed for use primarily by local agencies at rural, two-way stop intersections. Called the ALERT System, it uses a simple but ingenious combination of radar, wireless communication and flashing LEDs to alert drivers to the presence of approaching vehicles, thereby helping them identify safe gaps in the cross traffic and avoid potentially deadly collisions.
These types of systems are nothing new; MnDOT and other state DOTs have been developing them for more than a decade under the ENTERPRISE pooled fund program. MnDOT also recently kicked off a three-year project to deploy 20–50 of its Rural Intersection Conflict Warning Systems at selected at-risk intersections across the state. The main difference with the ALERT System is that it’s designed to be cheaper and easier to deploy than existing ICWS technologies. While that might sound like an incremental improvement, the difference for cash-strapped local agencies could be huge.
Since the ALERT System uses solar power, it doesn’t have to be hooked up to the power grid — which means that, in theory, county public works crews could install it themselves. The system also uses a simplified controller that doesn’t require a traffic signal technician to install and maintain, and detects vehicles using radar rather than in-pavement sensors. These factors might encourage greater adoption of ICWS technologies, which studies have shown to reduce both the frequency and severity of crashes.
The project is now in its second phase. It still faces a number of hurdles before could be ready to deploy, but Vic Lund, the traffic engineer for St. Louis County and the project’s main champion, says the results so far have been encouraging. In the video below, Lund shares his thoughts on the project, its challenges and the future of Intelligent Transportation Systems in Minnesota.
Learn more:
- Warning system aims to alert drivers to potential crashes (Catalyst article)
- Advanced LED Warning Signs for Rural Intersections Powered by Renewable Energy (Technical Summary)
- Advanced LED Warning Signs for Rural Intersections Powered by Renewable Energy (Research Report – Phase 1)

Friday fun: Mythbusters pits roundabouts against four-way stop intersections
Transportation research comes in many different forms and methodologies…
