Category Archives: Traffic and Safety

RailVolution showcases Minnesota transit successes

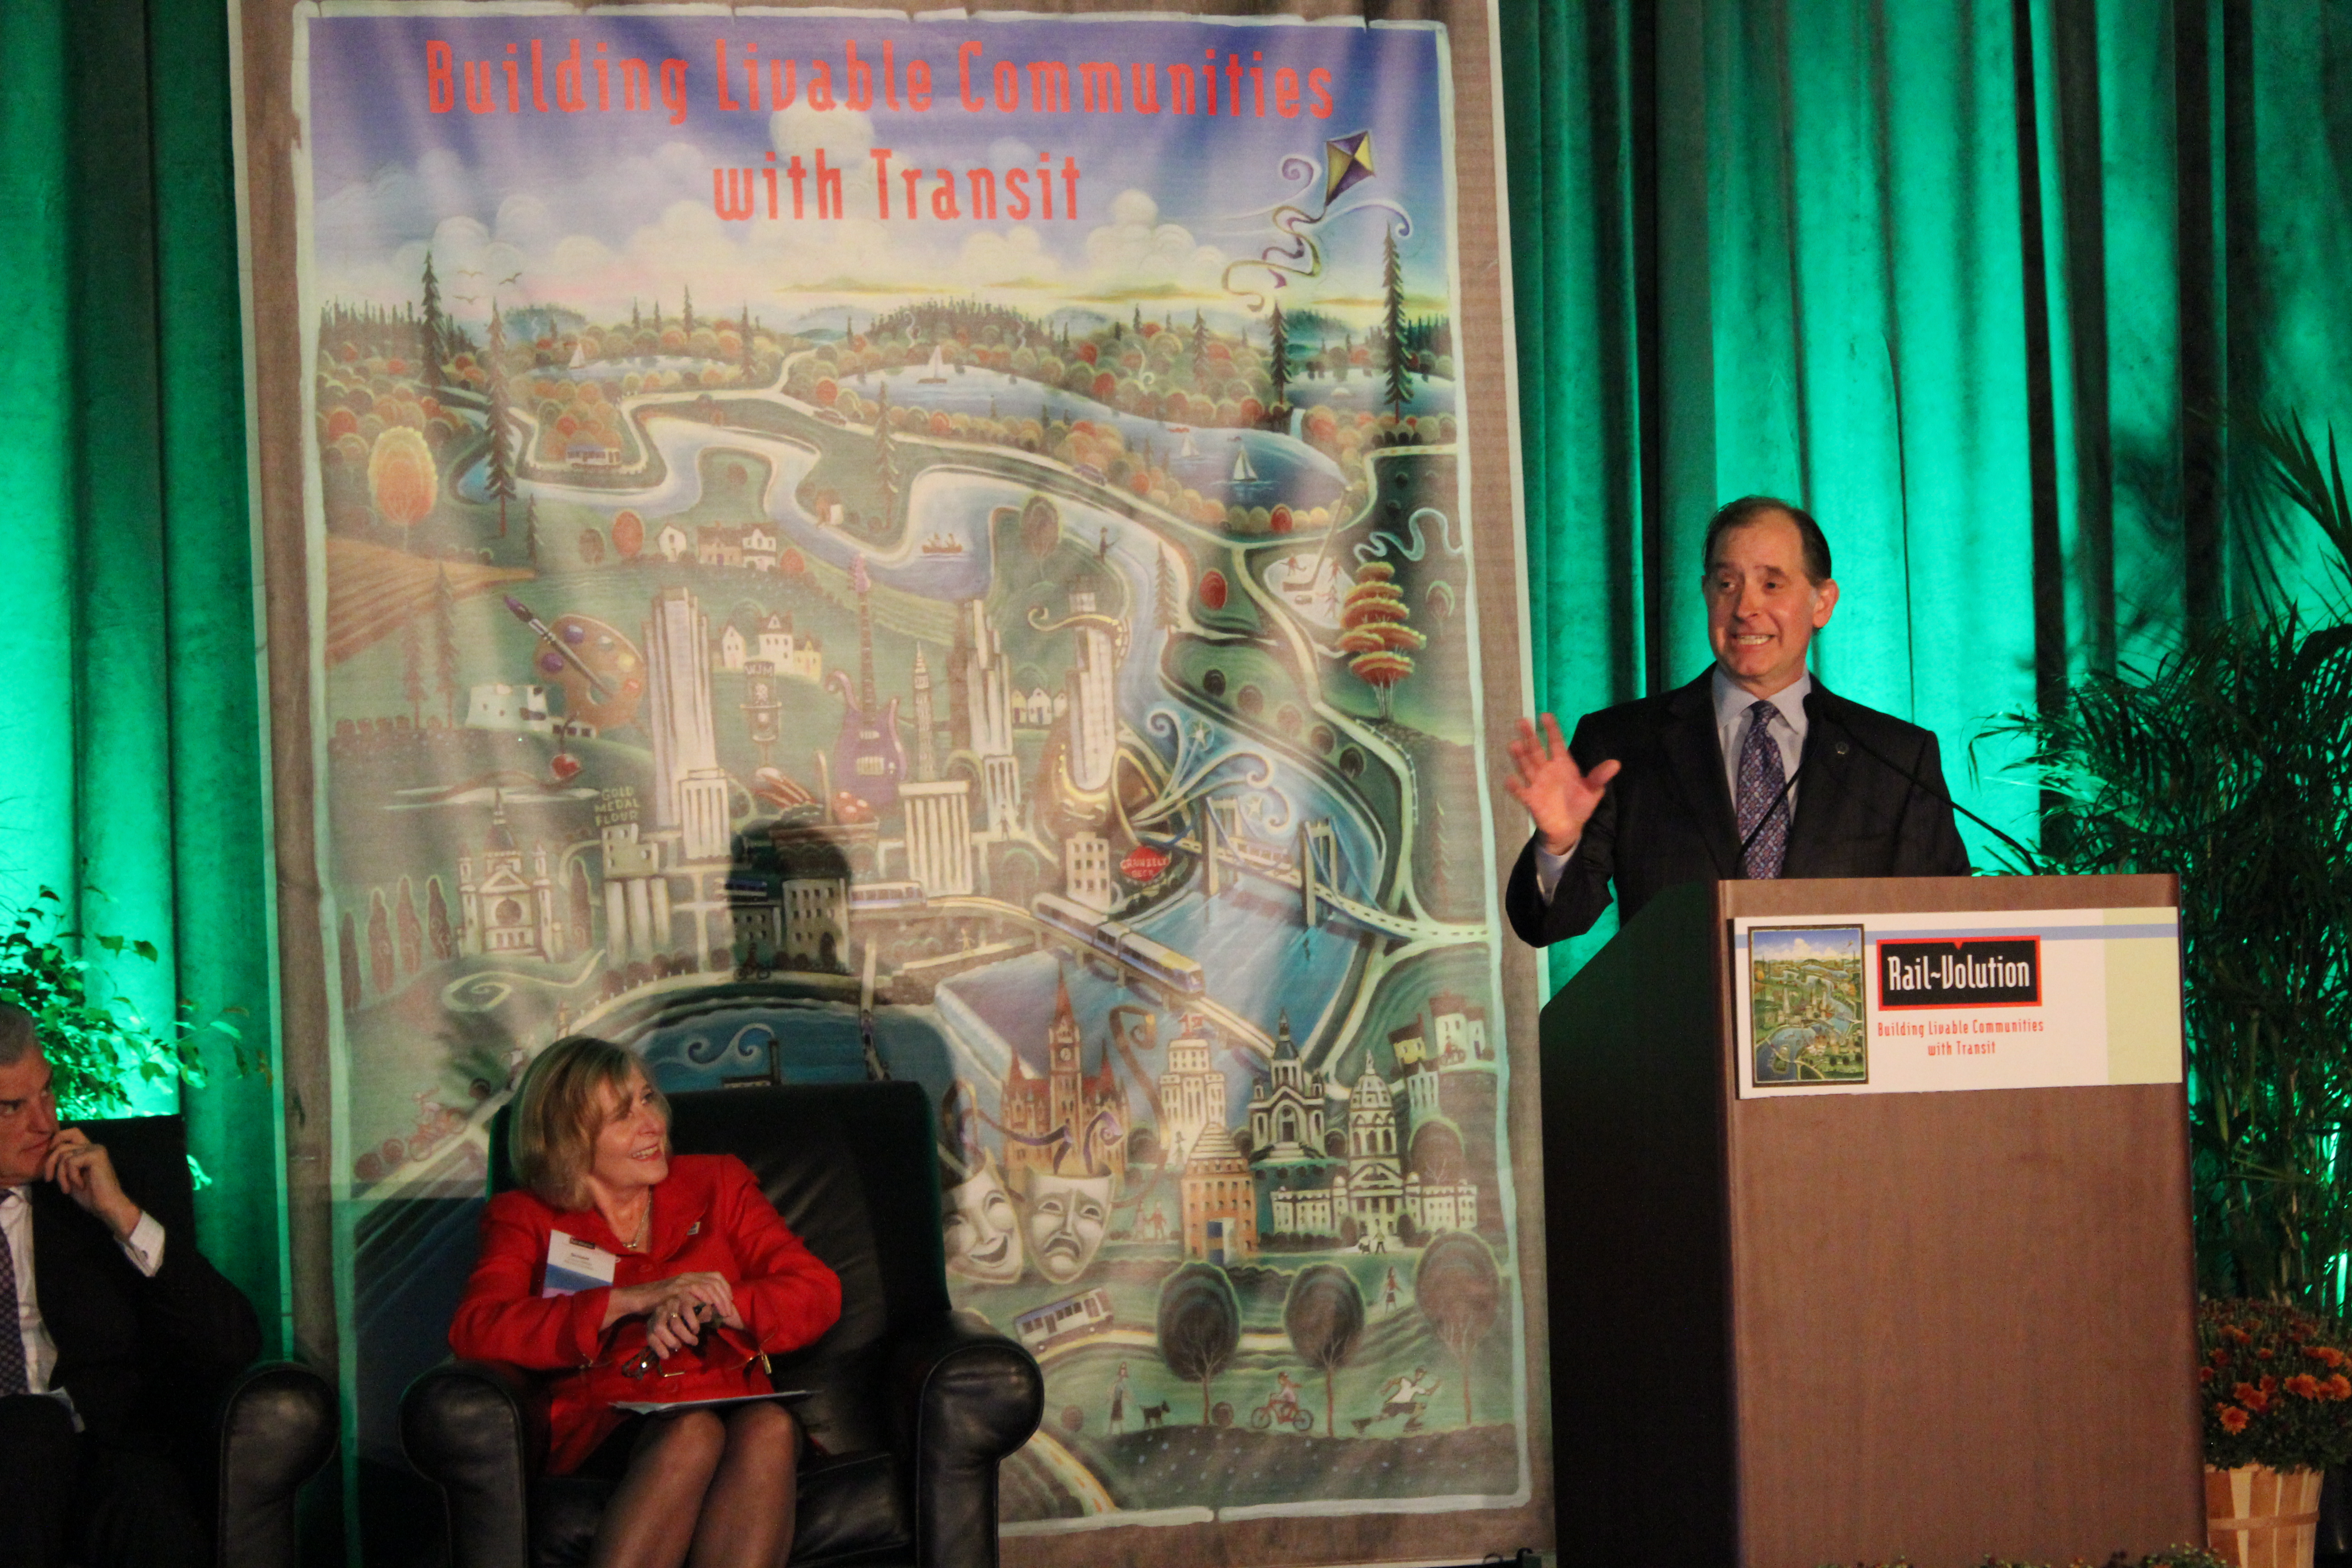
Before a national audience of 1,400 urban planners and transit enthusiasts, Hennepin County Commissioner Peter McLaughlin and others told the story of how the Twin Cities metropolitan area was transformed into a community that embraces “livability” and mass transit, including light rail.

“The growth was horizontal and there were lots of people who were saying it wouldn’t work in Minnesota,” said McLaughlin, during the opening plenary of the RailVolution conference in Minneapolis.

But the metro region bucked years of infighting and helped pass a transportation bill in 2008 that allows counties to tax for the expansion of transit in the metro area. Anoka, Ramsey, Hennepin, Dakota and Washington Counties decided to pool their resources from the quarter-cent transit sales tax, which is why the Southwest Light Rail Line is able to move forward.

“They had to believe their day would come,” McLaughlin said of the counties.

MnDOT Commissioner Charles Zelle, who ran a regional bus company before being appointed to MnDOT, said it was faster for him to bike to the conference than to take his car.

This was the first time the annual conference has been held in the Twin Cities, allowing Minnesota leaders to share their success stories.

Minnesota Department of Transportation Commissioner Charlie Zelle, who biked the Greenway trail to get to the conference, spoke of MnDOT’s commitment to multi-modal transportation and maximizing the health of Minnesota’s people and economy.

“MnDOT is more than a highway department,” he said. “We have a statewide bike plan and we will probably be the second state in the union to have a statewide pedestrian plan.”

Michael Langley of Greater MSP said a mix of transportation types is critical to attracting  talented workers to the Twin Cities, especially millennials.

“Nearly every area of the world is facing a future workplace shortage,” he said. “It’s fueling a competition for talent like we’ve never seen.”

Federal Highway Administration Secretary Anthony Foxx on Tuesday addressed conference attendees about the need for a bipartisan compromise on funding. He proposed moving away from the Highway Trust Fund to a more inclusive transportation account (named the Surface Transportation Trust Fund) that also addresses rail needs, with $19 billion in proposed dedicated funding. He also discussed the recent announcement of $3.6 billion in resiliency funds for transit systems.

During his comments, he wore a red bicycle pin that the MnDOT commissioner frequently wears at multi-modal events.

During the five-day conference, attendees toured the recently completed Green Line and attended dozens of workshops on topics ranging from street walkability to bus-rapid transit to the use of mobile phones to enhance bus service. On Sunday, the Northstar commuter train traveled for the first time to St. Paul’s Union Depot and conference attendees took it back to Minneapolis.

Parking availability system takes aim at truck driver fatigue

MnDOT, in partnership with the Federal Highway Administration, is test-deploying a high-tech system to help combat drowsy driving and keep truck drivers in compliance with federal hours-of-service regulations.

Developed by researchers at the University of Minnesota, the prototype system lets  drivers know when parking spaces are available at rest stops ahead. It has been deployed at several locations along the heavily traveled I-94 corridor between Minneapolis and St. Cloud.

From today’s MnDOT news release:

ST. PAUL, Minn. – New technology along the I-94 corridor west and northwest of the Twin Cities is helping truckers find safe places to park. Three Minnesota Department of Transportation rest areas are now equipped with automated truck stop management systems that tell truck drivers when parking spaces are available.

The technology will improve safety, lead to better trip and operations management by drivers and carriers and help MnDOT and private truck stop owners manage their facilities more effectively, according to John Tompkins, MnDOT project manager.

“So far, the results have been positive. We’ve had 95 percent accuracy in determining the availability of spaces,” he said.

Federal hours of service rules require truck drivers to stop and rest after 11 hours of driving. Tompkins said if drivers continue to drive beyond 11 hours, they could become fatigued and be forced to park in unsafe locations such as freeway ramps. They could also face legal penalties.

The problem of truck driver fatigue recently took the national spotlight when an allegedly drowsy driver slammed his semitrailer into a limousine carrying actor-comedian Tracy Morgan and six others. One passenger died in the crash.

The parking availability project is led by MnDOT Freight Project Manager John Tompkins and University of Minnesota professor Nikolaos Papanikolopoulos. MnDOT Research Services & Library produced the video above, which demonstrates the system in action. You can learn more about the project on the Center for Transportation Studies website.

Five Innovative Ways to Make Bicyclists and Pedestrians Safer

Last year, 41 people were killed while walking or biking on Minnesota roads and nearly 1,700 were injured.

Dozens of measures are available, however, for making roads safer for pedestrians and cyclists. Minnesota Department of Transportation Pedestrian and Bicycle Safety Engineer Melissa Barnes reviewed some of these design techniques in a recent presentation to city and state transportation engineers. (Watch the full webinar.)

We asked Barnes to highlight her favorite bike and pedestrian safety countermeasures used in Minnesota.

Rectangular Rapid Flashing Beacon RRFB

An unusually effective new pedestrian warning device, called the Rectangular Rapid Flashing Beacon, has become quite popular.

User-activated, the device alerts drivers to a pedestrian’s presence with a bright flashing beacon that “looks kind of like an ambulance or fire truck light,” Barnes said. (RRFBs can also be activated passively by a pedestrian’s presence.)

Studies have shown that the number of motorists stopping for pedestrians increases from 18 to 81 percent with the RRFB. Another plus: the device doesn’t appear to lose its effectiveness over time. After two years, compliance has been shown to still be more than 80 percent.

Advanced Stop Lines

It’s not uncommon for a motorist to stop for someone in a crosswalk, only for the vehicle following them to not see the pedestrian and veer around, driving through the crosswalk.

But an advanced stop line, placed 20 to 50 feet prior to a crosswalk, is effective at making both vehicles stop and see the person in the crosswalk.

“They are a really good option at an unsignalized, mid-block crossing,” said Barnes, although the stop line may not be a good option for a two-way stop.

Advanced stop lines have been shown to reduce pedestrian-vehicle conflict up to 90 percent; however, stop lines shouldn’t be placed too far in advance of the crossing, because motorists might then ignore them.

Leading Protected Interval

An innovative treatment called the Leading Protected Interval minimizes conflict by allowing pedestrians to enter a signalized intersection before vehicles do.

The walk signal begins three to seven seconds before the parallel street turns green by extending the time all lights are red.

A right turn on red can be prohibited with this device; however, even without the prohibition, the Leading Protected Interval has been shown to reduce crashes by 5 percent.

Protected Bike Lanes

Protected Bike Lanes

Bike lanes buffered from  traffic with some sort of physical barrier, even parked cars, will reduce all types of crashes. They also increase comfort levels for cyclists, helping keep bikes off the sidewalk.

“A lot of people are much more comfortable biking in these than a regular bike lane,” Barnes said. “It can be a very effective solution for places with lots of cyclists.”

Protected bike lanes, also called cycle tracks, also have a traffic-calming effect.

In New York City, the cycle track reduced all types of crashes an average of 40 percent and up to 80 percent on some roads.

“The challenge is how to design these at intersections,” Barns said. “It’s hard to get the turns right and get everybody visible. It’s pretty important to design these carefully at intersections.”

For those reasons, two-way cycle tracks work best on one-way streets, she said.

Flexible Bollards
Flexiblebollard
Photo courtesy of Reliance Foundry

Flexible bollards create temporary curb lines that encourage vehicles to slow down. They can be installed easily and inexpensively.

Flexible bollards bend up to 90 degrees when struck by an errant vehicle. They do not physically stop a car, but encourage vehicles to stay within their lane. Although they can create additional maintenance, they are a good interim solution at locations that need an immediate fix, but have no funding to do so.

Six effective low-cost safety improvements for roads

For the past 10 years, Minnesota and 37 other states have pooled their resources to test the effectiveness of roadway safety improvement strategies. The project, appropriately titled “Evaluation of Low-Cost Safety Improvements,” evaluates key strategies laid out in a national guidebook aimed at reducing the number of annual highway deaths.

Participating states say the project, which has now been extended a total of eight times beyond its original scope, has been a resounding success. MnDOT Safety Engineer Brad Estochen said the pooled-fund study has provided state DOTs much-needed evidence to gain support for implementing new safety improvements.

“Some states want to do a certain strategy, but don’t have the institutional support,” Estochen said. “Through the collaboration of the Peer Exchange, they have national results they can point to.”

We asked Estochen, MnDOT’s technical liaison for the pooled fund, to name his top strategies to come out of the study.

Traffic calming measures

Roadway

One phase of the study used simulated driving scenes to examine methods of traffic calming (i.e., getting drivers to slow down) in  rural towns. The research found that drivers were most impacted by chicanes — extra curves in the road — and the presence of parked cars on the street. An alternative strategy, curb extensions (also called “bulb-outs”), was found to offer only a small potential safety benefit or no benefit at all.

(Read more about this phase of the study.)

Nighttime visibility improvements

DSC_6498

Researchers also looked at ways of improving nighttime driver visibility on rural roads. Edge lines and post-mounted delineators were selected as the best alternatives for improving curve visibility at night, with curve detection improving 12 percent to 70 percent due to enhanced edge lines. The results are significant, since horizontal curve sections of two-lane rural roads are a major source of roadway fatalities.

(Read more about this phase of the study.)

Flashing beacons at stop-controlled intersections

One way to make drivers aware that they’re approaching a stop sign is to add a flashing beacon to the intersection. Researchers installed various configurations of flashing beacons at more than 100 sites in North and South Carolina and examined the crash data before and after installation.

Courtesy of K-Kystems

Results indicate that standard flashing beacons, as well as some “actuated” beacons (i.e. those that only turn on when traffic is approaching the intersection), are not only effective at reducing crashes, but also economically justifiable based on cost-benefit calculations.This research helped pave the way for more widespread adoption of Minnesota’s Rural Intersection Conflict Warning Systems (RICWS).

(Read more about this phase of the study.)

Edgeline rumble strips

DSC_4106pse

Edgeline rumble strips on curves were shown to significantly improve safety in the third phase of the study, which tested a variety of techniques.

Whereas rumble strips are traditionally ground into centerline or on the shoulder, Kentucky and Florida experimented with placing rumble strips right along the white edgeline of curved sections of road. This method was shown to reduce overall crashes by 29 percent.

(Watch the FHWA website for updates on this phase of the study.)

Red light enforcement devices

Red light indicator
In Florida, crashes due to people running the red light fell by 33 percent thanks to a small light that turns on when the signal turns red. This little light bulb, which is placed on top of a signal, allows for a police officer to sit at the other end of the intersection rather than pursue a car right through the intersection. Not only is it safer, but motorists are also more likely to obey the signal if they know police might be watching on  the other side.

Researchers are also still collecting data on the other techniques studied in phase three, including surface friction treatments on curves and ramps and larger curve warning signs (called chevrons). Watch the FHWA website for updates.

Wider roads in rural areas

manufacturing

Could simply shifting the edge lines of a rural road reduce the number of accidental drive-offs?

Yes, according to this study, which evaluated the effectiveness of various lane-shoulder width configurations on rural, two-lane undivided roads using data from Pennsylvania and Washington.

In general, results were consistent with previous research, showing crash reductions for wider paved widths, lanes and shoulders. For specific lane-shoulder combinations, the study found a general safety benefit associated with wider lanes and narrower shoulders for a fixed pavement width; however, there are exceptions. The report has a chart that shows the optimal lane-shoulder combinations for different sizes of roads.

In theory, there should be no additional cost for these strategies, as an edgeline can be re-striped as part of an existing resurfacing project.

MnPASS: Two systems, both work

I-35W’s MnPASS lane, where vehicles can frequently enter and exit the high-occupancy toll lane, is just as safe as the MnPASS lane on I-394, where motorists only have a few shots to enter the system, a new study finds.

Researchers at the Minnesota Traffic Observatory undertook the MnDOT-funded study because of objections to open systems like the one on 35W.

“The federal government has very strong arguments against the open system. They’re saying it’s going to be dangerous – cause more disruption and more congestion,” said John Hourdos, director of the Minnesota Traffic Observatory. “We found that both roadways are working very well today because they were designed appropriately for their location.”

The definition of an open system is one that has more opportunity for access than restriction. On 35W, a dotted white lane means vehicles can enter the toll lane at will, and a solid line bars access.

Vehicles must have two occupants on-board or an electronic pay card to use the express lanes during rush hour.

MnPASS on Highway 35W.

The reason I-35W allows vehicles to enter MnPASS more frequently than I-394 is because there are more ramps where new vehicles are entering the freeway and might want to get on MnPASS.

Researchers studied whether accidents are more likely to occur by studying the number of accident-inducing vehicle movements along the 35W corridor. They found that areas where accidents are mostly likely to occur are also where the lane would have to allow access anyway under a closed system like 394.

The study also looked at mobility, determining that MnPASS users have just as good free-flowing traffic under the open system.

Helpful tools

Researchers also created design tools that engineers can use to determine where access points should be on MnPASS lanes.

Until now, engineers have relied on rule of thumb. For example, the general guidance for allowing access on a closed system was 500 feet for every lane between the entrance ramp and the HOT.

The tools can be used to automatically determine how fluctuations in the MnPASS fee will affect congestion within the lane.

The fee to use MnPASS depends on the time of day.

As the express lane become more congested, the fee to use it increases. This slows the number of cars entering the lane, increasing the speed of the vehicles already in the lane.

“We ran the tool on three locations on 35W and found that, for example, on Cliff Road, you can increase the traffic by 75 percent and still be okay,” Hourdos said. “You have more leeway there than north of the crossroads of Highway 62 and 35W, for instance.”

 Related Resources

What those signs over the freeway are actually telling you

Two years ago, MnDOT installed a series of electronic speed limit advisory signs over Interstate 94 between Minneapolis and St. Paul. The Variable Speed Limit (VSL) system is designed to reduce congestion and help prevent crashes by recommending lower speed limits to motorists during periods of high traffic.

The new technology has worked in other places, including China and Germany. In Minnesota, a similar VSL system on I-35W reportedly had moderate benefits in reducing the total amount of congestion during the morning commute south of Minneapolis.

Although the verdict on I-94 congestion is still pending,  a newly released study has found that the new system has not made a measurable impact so far on crashes in an accident-prone stretch of freeway in downtown Minneapolis. Why not?

University of Minnesota researcher John Hourdos has a few theories.

One is a simple time  lag in the congestion reporting system. Another is a requirement that all lanes display the same speed limit, which he said causes confusion when only one lane is actually congested. The complexity of the I-94 commons also appears to be beyond what the VSL system was designed to do. And according to Hourdos, one of the most significant problems is the driving public simply doesn’t understand what the signs are telling them.

“People do not know what the system really does,” Hourdos said. “There hasn’t been much education on it other than a couple of news articles over the years. And when they try to decipher it on their own they get even more confused.”

The I-94 Commons area has a major bottleneck where the I-35W northbound ramp merges with I-94 westbound (between Cedar Avenue and 11th Avenue). Vertical red lines indicate locations of gantries that display variable speed limit advisories.

The advisory speed limits are posted in response to varying traffic conditions. As vehicles approach the commons area, the system measures speeds at the bottlenecks. If the traffic slows, the system transmits a reduced advisory speed to drivers approximately 1.5 miles upstream from the location of the slow-down.

Hourdos said many motorists mistakenly believe the speed displayed on the signs is either a reflection of the speed on the current stretch of highway or an indication of the speeds on the highway ahead, rather than a suggested speed for them to follow.

The requirement to display the same speed limit on all signs also compounds the problem, Hourdos said, because when drivers see that the slowdown is only occurring in certain lanes they tend to ignore the signs altogether.

“In the lane that is congested, the real speeds drop much faster than what the VSL system can respond to, reducing the functionality of the system to the eyes of the drivers,” Hourdos said, “while on the fast-moving lanes, it seems the system has no purpose at all.”

From downtown Minneapolis rooftops, traffic monitoring cameras detect shockwaves on Interstate 94.
Data was primarily collected via cameras at the I-94 Commons’ Third Avenue Field station, overlooking an area with a particularly high crash rate.

So is the I-94 VSL system useless? Not necessarily. For one, the new study didn’t measure the system’s impact on congestion — only its ability to reduce crashes on a small portion of I-94. Moreover, the area in question, the I-94 Commons, is fairly unique, having two major bottlenecks, the highest crash rate in the state (nearly one every other day), and five hours of congestion during the afternoon rush hour alone.

“The VSL system was designed for implementation on any freeway and may not have been well-suited for the I-94 Commons area, which is a very complex corridor with high volume weaves and significant shockwave activity,” said MnDOT Freeway Operations Engineer Brian Kary.

Generally speaking, the VSL system was designed to identify slow traffic ahead of where free-flowing traffic is approaching slow or stopped traffic.

“The crash problems within the commons are caused by speed differentials between lanes and shockwave activity within the congestion,” Hourdos said. “The current VSL system was not developed to handle these types of conditions.”

MnDOT and the researchers aren’t giving up, either. A new project is starting later this year to develop and deploy a queue warning system specifically for this high-crash rate location.

Further resources

Investigation of the Impact of the I-94 ATM System on the Safety of the I-94 Commons High Crash Area (PDF), May 2014

Improving Traffic Management on Minnesota Freeways (PDF), May 2012

Study to develop bridge load limits for tractors

Minnesota farm equipment is getting larger and heavier, causing strain on rural bridges. However, there are no  nationally recognized specifications for what size and weight of tractors can safely travel over them.

Currently, bridge load limits are based off semi-trucks, not farm machinery, which have much different axle configurations and wheel dimensions.

“Their geometry is atypical; their length, widths are different; they have different suspension characteristics,” explains Brent Phares, director of the Bridge Engineering Center at Iowa State University.

A new pooled fund study led by the state of Iowa is attempting to determine how much stress heavy farm vehicles put on bridges. This data will be used by local agencies to develop weight restrictions specifically for farm equipment.

“It will help limit the confusion of current load posting signs for farmers,” said MnDOT bridge load rating engineer Moises Dimaculangan.

Wisconsin, Minnesota, Nebraska, Oklahoma, Illinois, Kansas and the United States Department of Agriculture are also participating in the study, which is examining three types of local bridge superstructures: those with steel girders and concrete decks; bridges with steel girders and timber decks; and timber bridges with timber decks.

Through physical testing and modeling, the study will determine how different types of farm machinery distribute their loads on the bridge superstructure.

About a half-dozen farm vehicles were tested on 20 different bridges which were representative of those tending to be the most problematic for farm equipment traffic on secondary road systems, Phares said.

Instrumentation measured the response of the structures to the vehicles. This data was then used as a baseline to calibrate analytical models, which could be applied to 250 different bridges and 121 different farm vehicles.

Researchers will develop a generic tractor profile, which represents the worst-case scenario, for use in determining load limits. With the information developed, signs might be able to be added to the bridges, which show a tractor and the weight limit.Collapsed bridge

“I get a number of pictures emailed to me of bridges that have failed with a tractor implement of husbandry on top,” Phares said. “That’s the problem that people are looking to avoid; the goal isn’t to restrict the size of farm vehicles, but to develop better tools for engineers to make sound and solid analyses for the bridges, so they can provide that information to the people who need to have it.”

Phares said a couple previous studies have also looked at farm machinery weight restrictions. One study, from around 2004, took a high level look at the impact of farm vehicles on bridges. A more recent pooled fund study analyzed the impact of machinery on pavements.

Related resources

Research in Progress: Study of the Impacts of Implements of Husbandry on Bridges

The Effects of Implements of Husbandry “Farm Equipment” on Pavement Performance

Primary seat belt law continues to save lives, money

Minnesota’s primary seat belt law continues to save lives and reduce serious injuries more than four years after being passed, according to a study by researchers at the U of M’s Humphrey School of Public Affairs.

The study examined Minnesota crash data collected from June 2009 (when the law was implemented) through June 2013 and compared it to expected data based on crash trends over time. Findings indicate that there were at least 132 fewer deaths, 434 fewer severe injuries, and 1,270 fewer moderate injuries than expected during this time.

According to the researchers, the safety benefits of the law translate into a savings of at least $67 million in avoided hospital charges, including nearly $16 million in taxpayer dollars that would have paid for Medicare and Medicaid charges.

The study was sponsored by the Minnesota Department of Public Safety and led by Humphrey School research fellow Frank Douma and Nebiyou Tilahun, a U of M graduate now on the faculty at the University of Illinois-Chicago.

The researchers also examined seat belt use data and survey results that measured support for the law. Findings show that support increased from 62 percent just before the law was passed to more than 70 percent in 2013, while the percentage of Minnesotans buckling up was at an all-time high of nearly 95 percent in 2013. This shows that some people are wearing their seat belts even though they don’t support the law.

When this increased seat belt use is combined with the reduction in fatalities and injuries, it further demonstrates that people are surviving—and even walking away from—crashes that may have had different results if the primary seat belt law had not been in effect.

Read the full article in the June issue of CTS Catalyst.

Rumble Strips vs. Mumble Strips: Noise Comparison (Video)

We recently blogged about a research project to evaluate a new type of rumble strip that produces significantly less external noise than traditional designs. The above video, shot near Thief River Falls, Minnesota, shows a comparison between traditional rumble strip designs and the newer, “sinusoidal” rumble strips (a.k.a. “mumble strips”).

The life-saving benefits of rumble strips are well-established, but traditional designs produce external noise that residents consider to be a nuisance. The issue has pit safety concerns against quality-of-life concerns in some parts of the state. Researchers are investigating whether sinusoidal rumble strip designs, which are much quieter, are effective enough to combat drowsy or inattentive driving.

The video is not exactly a scientific comparison, but it does give the viewer a good sense of the difference in noise levels produced by the two styles of rumble strips. The results of the actual research project are expected to be available later this year.

What’s the life of a sign?

Traffic signs provide important information to drivers, and are a critical component of traffic safety. In order to be effective, their visibility and readability must be maintained under both day and night conditions.

Key to signs’ effectiveness is a quality known as retroreflectivity — the ability for signs to bounce light back toward a driver’s eyes, making them appear brighter and easier to read.  Retroreflectivity deteriorates with time, so transportation agencies need to actively maintain their signs.

A research project funded by the Local Road Research Board is developing a guide to help cities and counties better manage their signs, and also to meet a new Federal Highway Administration retroreflectivity management requirement while getting the lowest life-cycle costs.

Cities and counties have until June to establish a sign assessment or management method that will maintain minimum levels of sign retroreflectivity.

“Right now there’s a mixture of different management methods, with very little guidance as to what’s appropriate for your agency based on the signs you have and your labor force and equipment,” said Matt Lebens, a MnDOT research project engineer.

Since 1993, the Manual on Uniform Traffic Control Devices has included guidelines for minimum retroreflectivity of pavement markings and signs. The standards are meant to ensure that drivers, especially the growing population of elderly drivers, are able to detect, comprehend and react to traffic signs. The LRRB project is designed to help fill certain knowledge gaps in this area.

Measuring retroreflectivity

Possible methods for ensuring retroflectivity include night-time inspection; use of a reflectometer; spot-checking a sampling of signs that are the same age; or blanket replacement of signs once they reach a certain age.

Although the retroreflectivity of a sign is  guaranteed by its manufacturer to last a certain number of years, it commonly lasts much longer.

“Currently, we don’t have expected sign life guidance for agencies to use. Through this project, we are establishing a control deck for sign sheeting used in the state, and an expert panel will make recommendations on expected sign life ranges,” Lebens said.

Researchers reviewed retro-reflectivity studies from other states and also measured the retro-reflectivity of signs out in the field across Minnesota using a retroreflectometer. As part of this project, MnDOT is providing training on the retroreflectometer and will also make it available for loan to local municipalities. (Watch a video demonstration.)

At MnDOT’s MnROAD site,  control decks contain dozens of signs. In addition to measuring retroreflectivity, the MnDOT Materials lab is monitoring color fade, which has been a larger issue in Minnesota.

“By getting better data as to the real life in-field life span of the signs, agencies will have a more realistic and better informed value for sign life expectancy, as well as potentially reducing costs,” said MnDOT Senior Engineer Mark Vizecky.

Expected life

There’s been no definitive studies to date as to what the life of a sign is, said lead project investigator Howard Preston of CH2M Hill, but the research so far shows it is in well excess of manufacturer warranties.

Cities and counties will be advised to pick an expected sign life that goes beyond the warranty – and then stay tuned.

“The notion is to watch these signs until they fail,” Preston said. “The sheeting material is better than it used to be. The failure might be 20 or 30 years out.”

There are two basic types of reflective sheeting material: beaded and prismatic.

Although beaded is guaranteed to last 10 years, researchers anticipate a retroreflectivity life of between 12 and 20 years old.

For the prismatic material – which has a 12-year warranty – the life cycle is anticipated to be 20 to 30 years.

“Nobody knows for sure, because nobody has actually followed this material to failure in a controlled condition,” Preston said. “On the road, there are so many variables: vandalism, knock-downs, etc.”

A test deck at MnROAD.
Researchers look at the test deck at MnROAD. The study panel includes city and county engineers.
Resources

Traffic Sign Life Expectancy study – Technical Summary (PDF, 1 MB, 2 pages); Final Report (PDF, 2 MB, 45 pages)