Chip-sealing — spraying an asphalt emulsion over existing pavement and then covering it with fine aggregate — is a cost-effective alternative to resurfacing asphalt pavements. Traditionally, however, it has only been used on rural and low-volume urban roadways.
During a recent visit to MnROAD, we filmed a road crew chip-sealing a test section on I-94 and spoke with MnDOT Research Project Supervisor Tom Wood, who explained why chip sealing can also be an effective treatment for high-volume roadways.
*Note: This story was updated on 08/12/2014 to clarify that the chip sealing shown in the video involves spraying an “asphalt emulsion” rather than “hot liquid asphalt,” as stated in an earlier version of this post.
The only way to test pavements is to destroy them — slowly and painstakingly, one moving vehicle at a time. At MnROAD, the state’s world-renowned pavement research facility, the bulk of this monotonous-but-necessary work is performed by live traffic passing through Albertville on I-94. But on the facility’s 2.5-mile low volume road test track, which simulates rural road conditions, more controlled methods are preferred.
Doug Lindenfelser is one of several MnROAD employees who take turns driving an 80,000-pound semi tractor trailer in laps around the closed-loop low-volume track. The truck is loaded to the maximum allowable weight limit on Minnesota roadways. As it passes over the facility’s 23 distinct low-volume test cells, an array of sensors capture data on the pavement’s performance, which researchers then use to design stronger, longer-lasting roads. The truck only drives on the inside lane; that way, the outside lane can be used as an “environmental lane” to compare damage caused by loading vs. damage caused by environmental factors.
He has other duties as well, but on a given day, Doug might drive the truck 60 or 70 times around the low-volume road test track. It might not sound very exciting, but as Doug explains, some days his job can be quite interesting. We interviewed him on camera during a recent visit to MnROAD. The resulting video is available above and on our YouTube channel.
For those who might be wondering, all this diligent destruction of pavement has paid off. It is estimated that MnROAD’s first phase of research (from 1994-2006) has resulted in cost savings of $33 million each year in Minnesota and $749 million nationally. Cost savings from its second phase (2007-2015) are being calculated, and the facility is scheduled to enter its third phase in 2016.
As public works employees come and go, past research efforts — and the valuable knowledge gained — often goes with them.
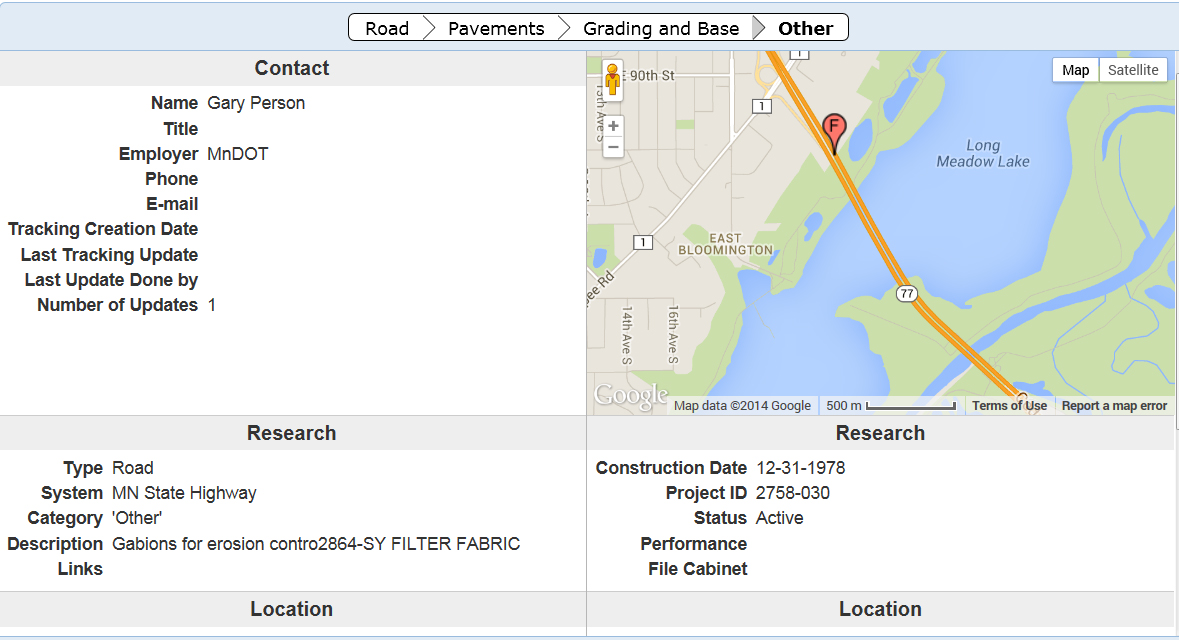
But a recently launched web application allows users to track innovative pavement projects for a lifetime.
“It’s something everyone has always said we need to have,” said MnDOT Research Operations Engineer Jerry Geib, who worked on the project for the Minnesota Local Road Research Board.
Using an online map, city and county engineers can enter road test sections that they want to observe for many years due to a particular construction method or material that was used. Too often, the knowledge about such projects is lost when a particular staff person leaves an agency.
Not only will the lessons learned be remembered within the organization, but the results can also be shared with others.
More than 1,400 projects (including some on state roads) previously identified by MnDOT have been entered into the system. Search fields allow users to look for a particular type of project anywhere in the state or they can zero the map in on a particular area of the state.
The website is still in beta form, but functional.
“It’s complete, we just want people to use it so we can improve it,” said MnDOT Research Project Engineer Melissa Cole, who began planning the site two years ago.
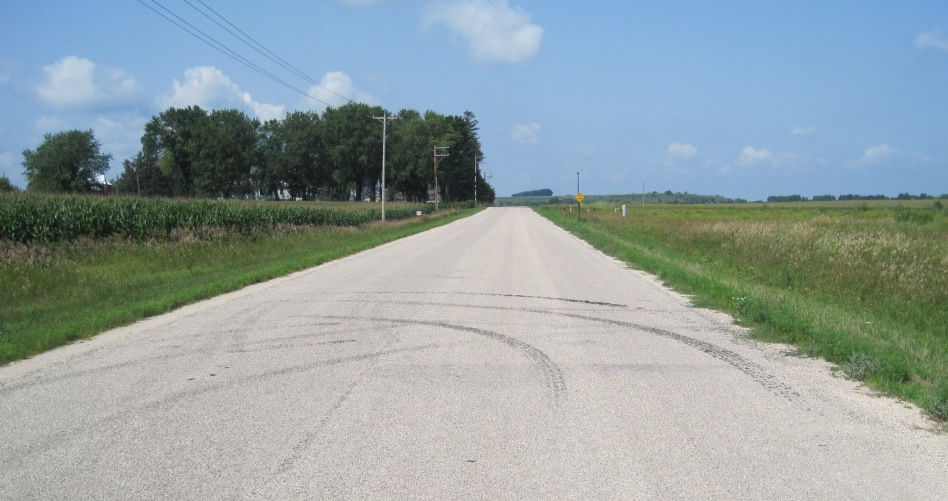
One featured project is a 1.8-mile section of dirt road in Wabasha County that had an Otta seal applied in 2007 (photo below). It is one of only a handful of lightly surfaced roads in the state (an improvement over a gravel road, but less expensive than asphalt ) so there is great interest in watching how it performs.
One of the projects being tracked is Wabasha County Road 73, one of only a handful of lightly surfaced (Otta seal) roads in the state.
More to come
The LRRB initiated the project in 2009, but it was put on the back burner for a while due to funding constraints. MnDOT ‘s technology staff began development of the current site about 11 months ago.
Anyone can look at the website, but cities and counties require permission to post projects (contact ResearchTracking.DOT@state.mn.us for credentials). They can upload photos, plans and weblinks relating to a particular project.
“We want to track anything that is worthy of looking at a few years from now,” Geib said.
Because the website uses Google maps, users can also view archived satellite and ground-level 360-degree imagery of the roads and bridges.
The website is viewable on a tablet, but it still must be tested on smart phones. Developers hope that crews will be able to submit information right from the field.
“We’re pretty happy with it,” said MnDOT software developer John Jones. “We think we’re headed in the right direction.”
The website might eventually be expanded for other areas, such as geotechnical (foundation work), whose practitioners have already expressed an interest.
A rumble strip applied to a center line on Highway 14 near New Ulm in 2004 is one of the projects being tracked.
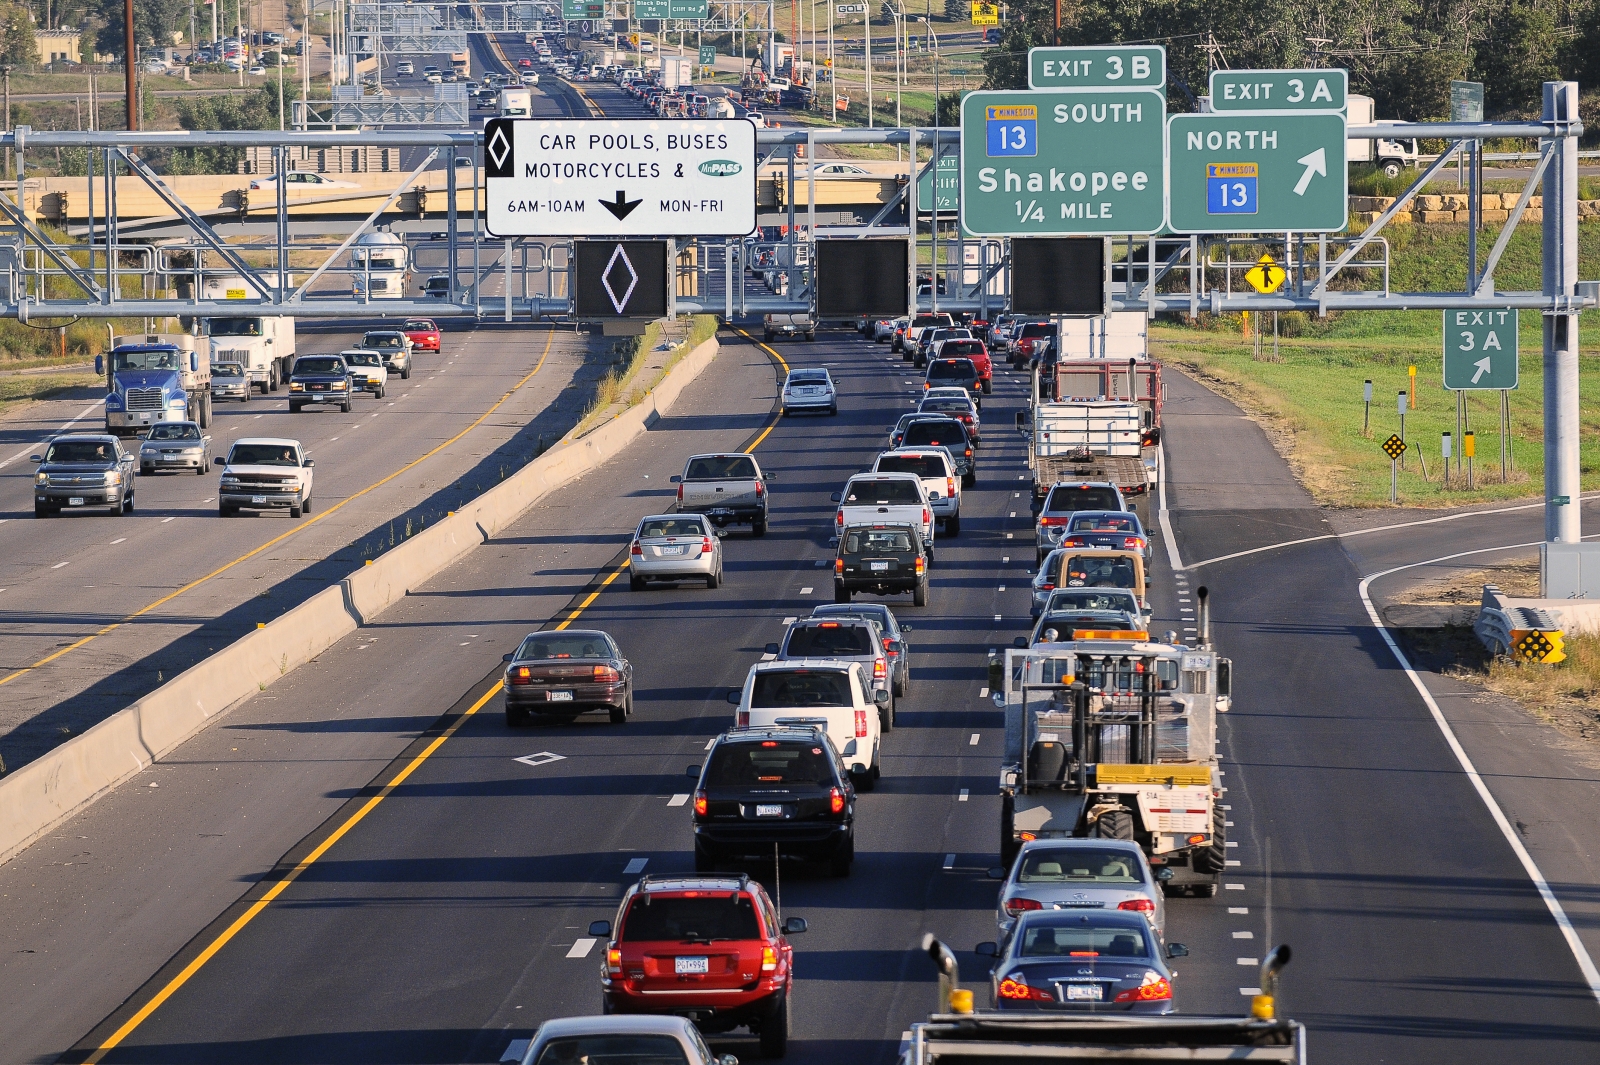
I-35W’s MnPASS lane, where vehicles can frequently enter and exit the high-occupancy toll lane, is just as safe as the MnPASS lane on I-394, where motorists only have a few shots to enter the system, a new study finds.
Researchers at the Minnesota Traffic Observatory undertook the MnDOT-funded study because of objections to open systems like the one on 35W.
“The federal government has very strong arguments against the open system. They’re saying it’s going to be dangerous – cause more disruption and more congestion,” said John Hourdos, director of the Minnesota Traffic Observatory. “We found that both roadways are working very well today because they were designed appropriately for their location.”
The definition of an open system is one that has more opportunity for access than restriction. On 35W, a dotted white lane means vehicles can enter the toll lane at will, and a solid line bars access.
Vehicles must have two occupants on-board or an electronic pay card to use the express lanes during rush hour.
MnPASS on Highway 35W.
The reason I-35W allows vehicles to enter MnPASS more frequently than I-394 is because there are more ramps where new vehicles are entering the freeway and might want to get on MnPASS.
Researchers studied whether accidents are more likely to occur by studying the number of accident-inducing vehicle movements along the 35W corridor. They found that areas where accidents are mostly likely to occur are also where the lane would have to allow access anyway under a closed system like 394.
The study also looked at mobility, determining that MnPASS users have just as good free-flowing traffic under the open system.
Helpful tools
Researchers also created design tools that engineers can use to determine where access points should be on MnPASS lanes.
Until now, engineers have relied on rule of thumb. For example, the general guidance for allowing access on a closed system was 500 feet for every lane between the entrance ramp and the HOT.
The tools can be used to automatically determine how fluctuations in the MnPASS fee will affect congestion within the lane.
The fee to use MnPASS depends on the time of day.
As the express lane become more congested, the fee to use it increases. This slows the number of cars entering the lane, increasing the speed of the vehicles already in the lane.
“We ran the tool on three locations on 35W and found that, for example, on Cliff Road, you can increase the traffic by 75 percent and still be okay,” Hourdos said. “You have more leeway there than north of the crossroads of Highway 62 and 35W, for instance.”
Related Resources
MnPASS Express Lanes: Open or Closed Access? — Technical Summary (PDF, 1 MB)
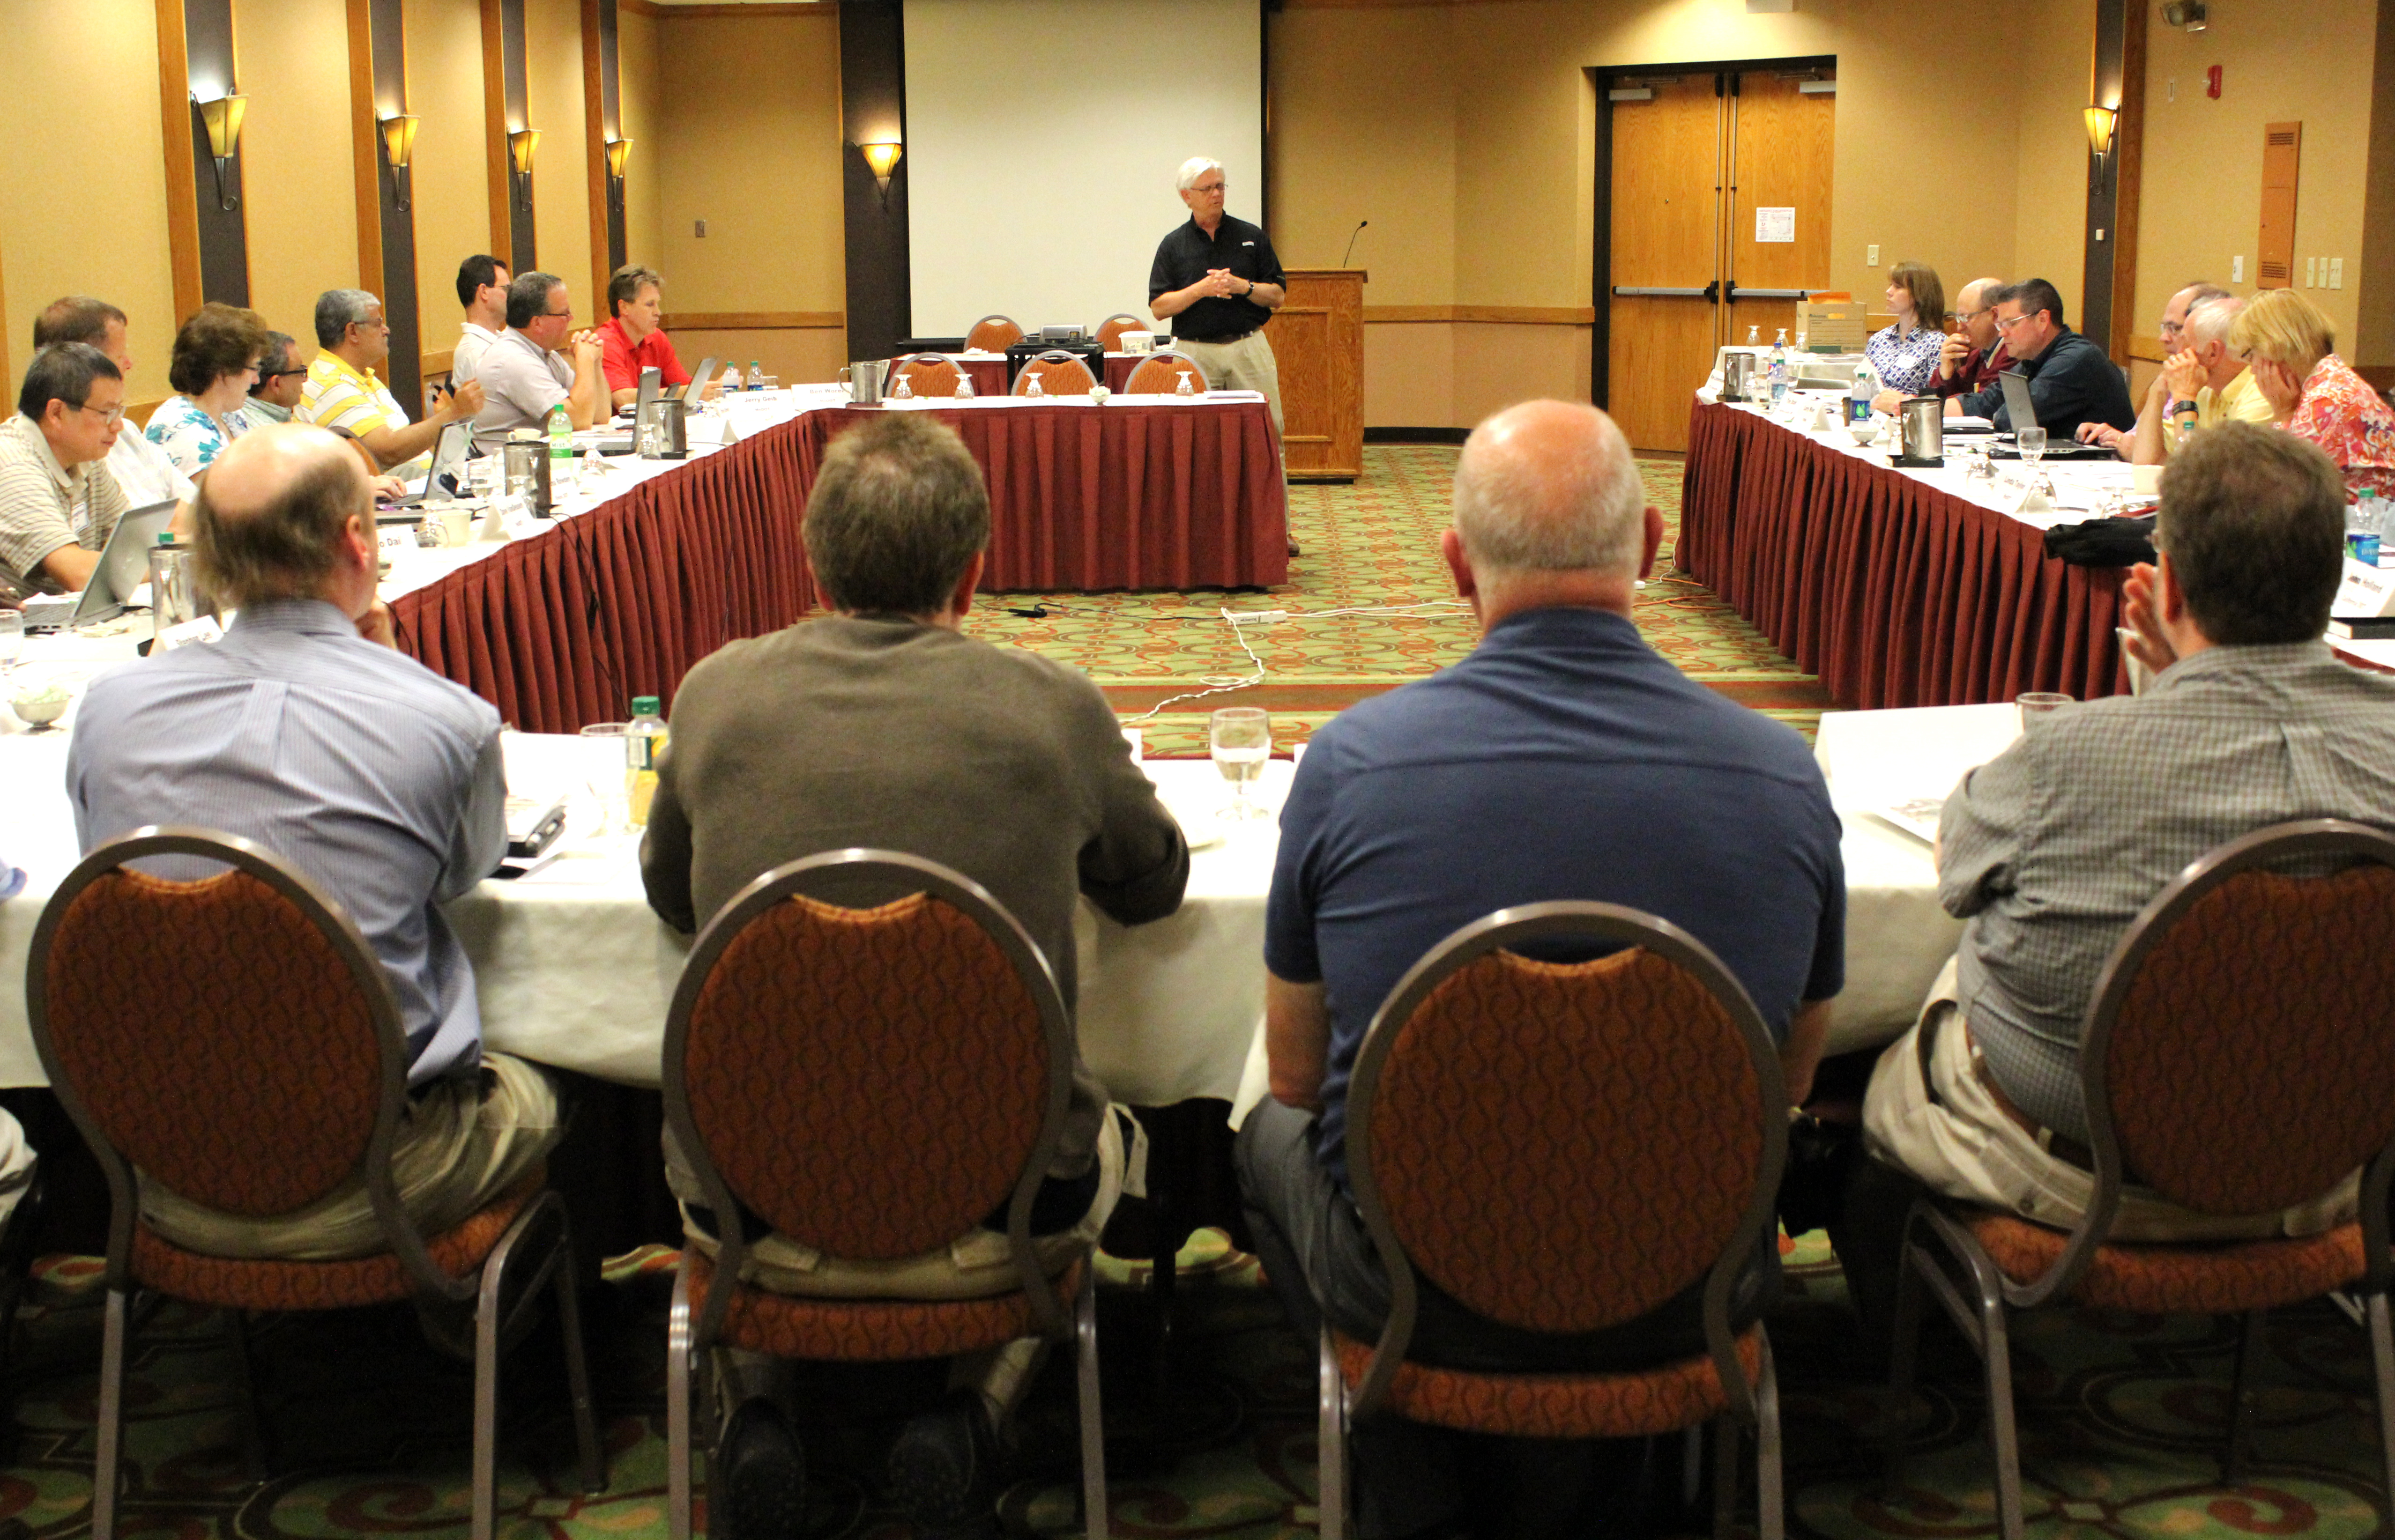
MnROAD is hosting pavement researchers from around North America this week to discuss research conducted at its cold weather pavement testing facility in Albertville, Minnesota.
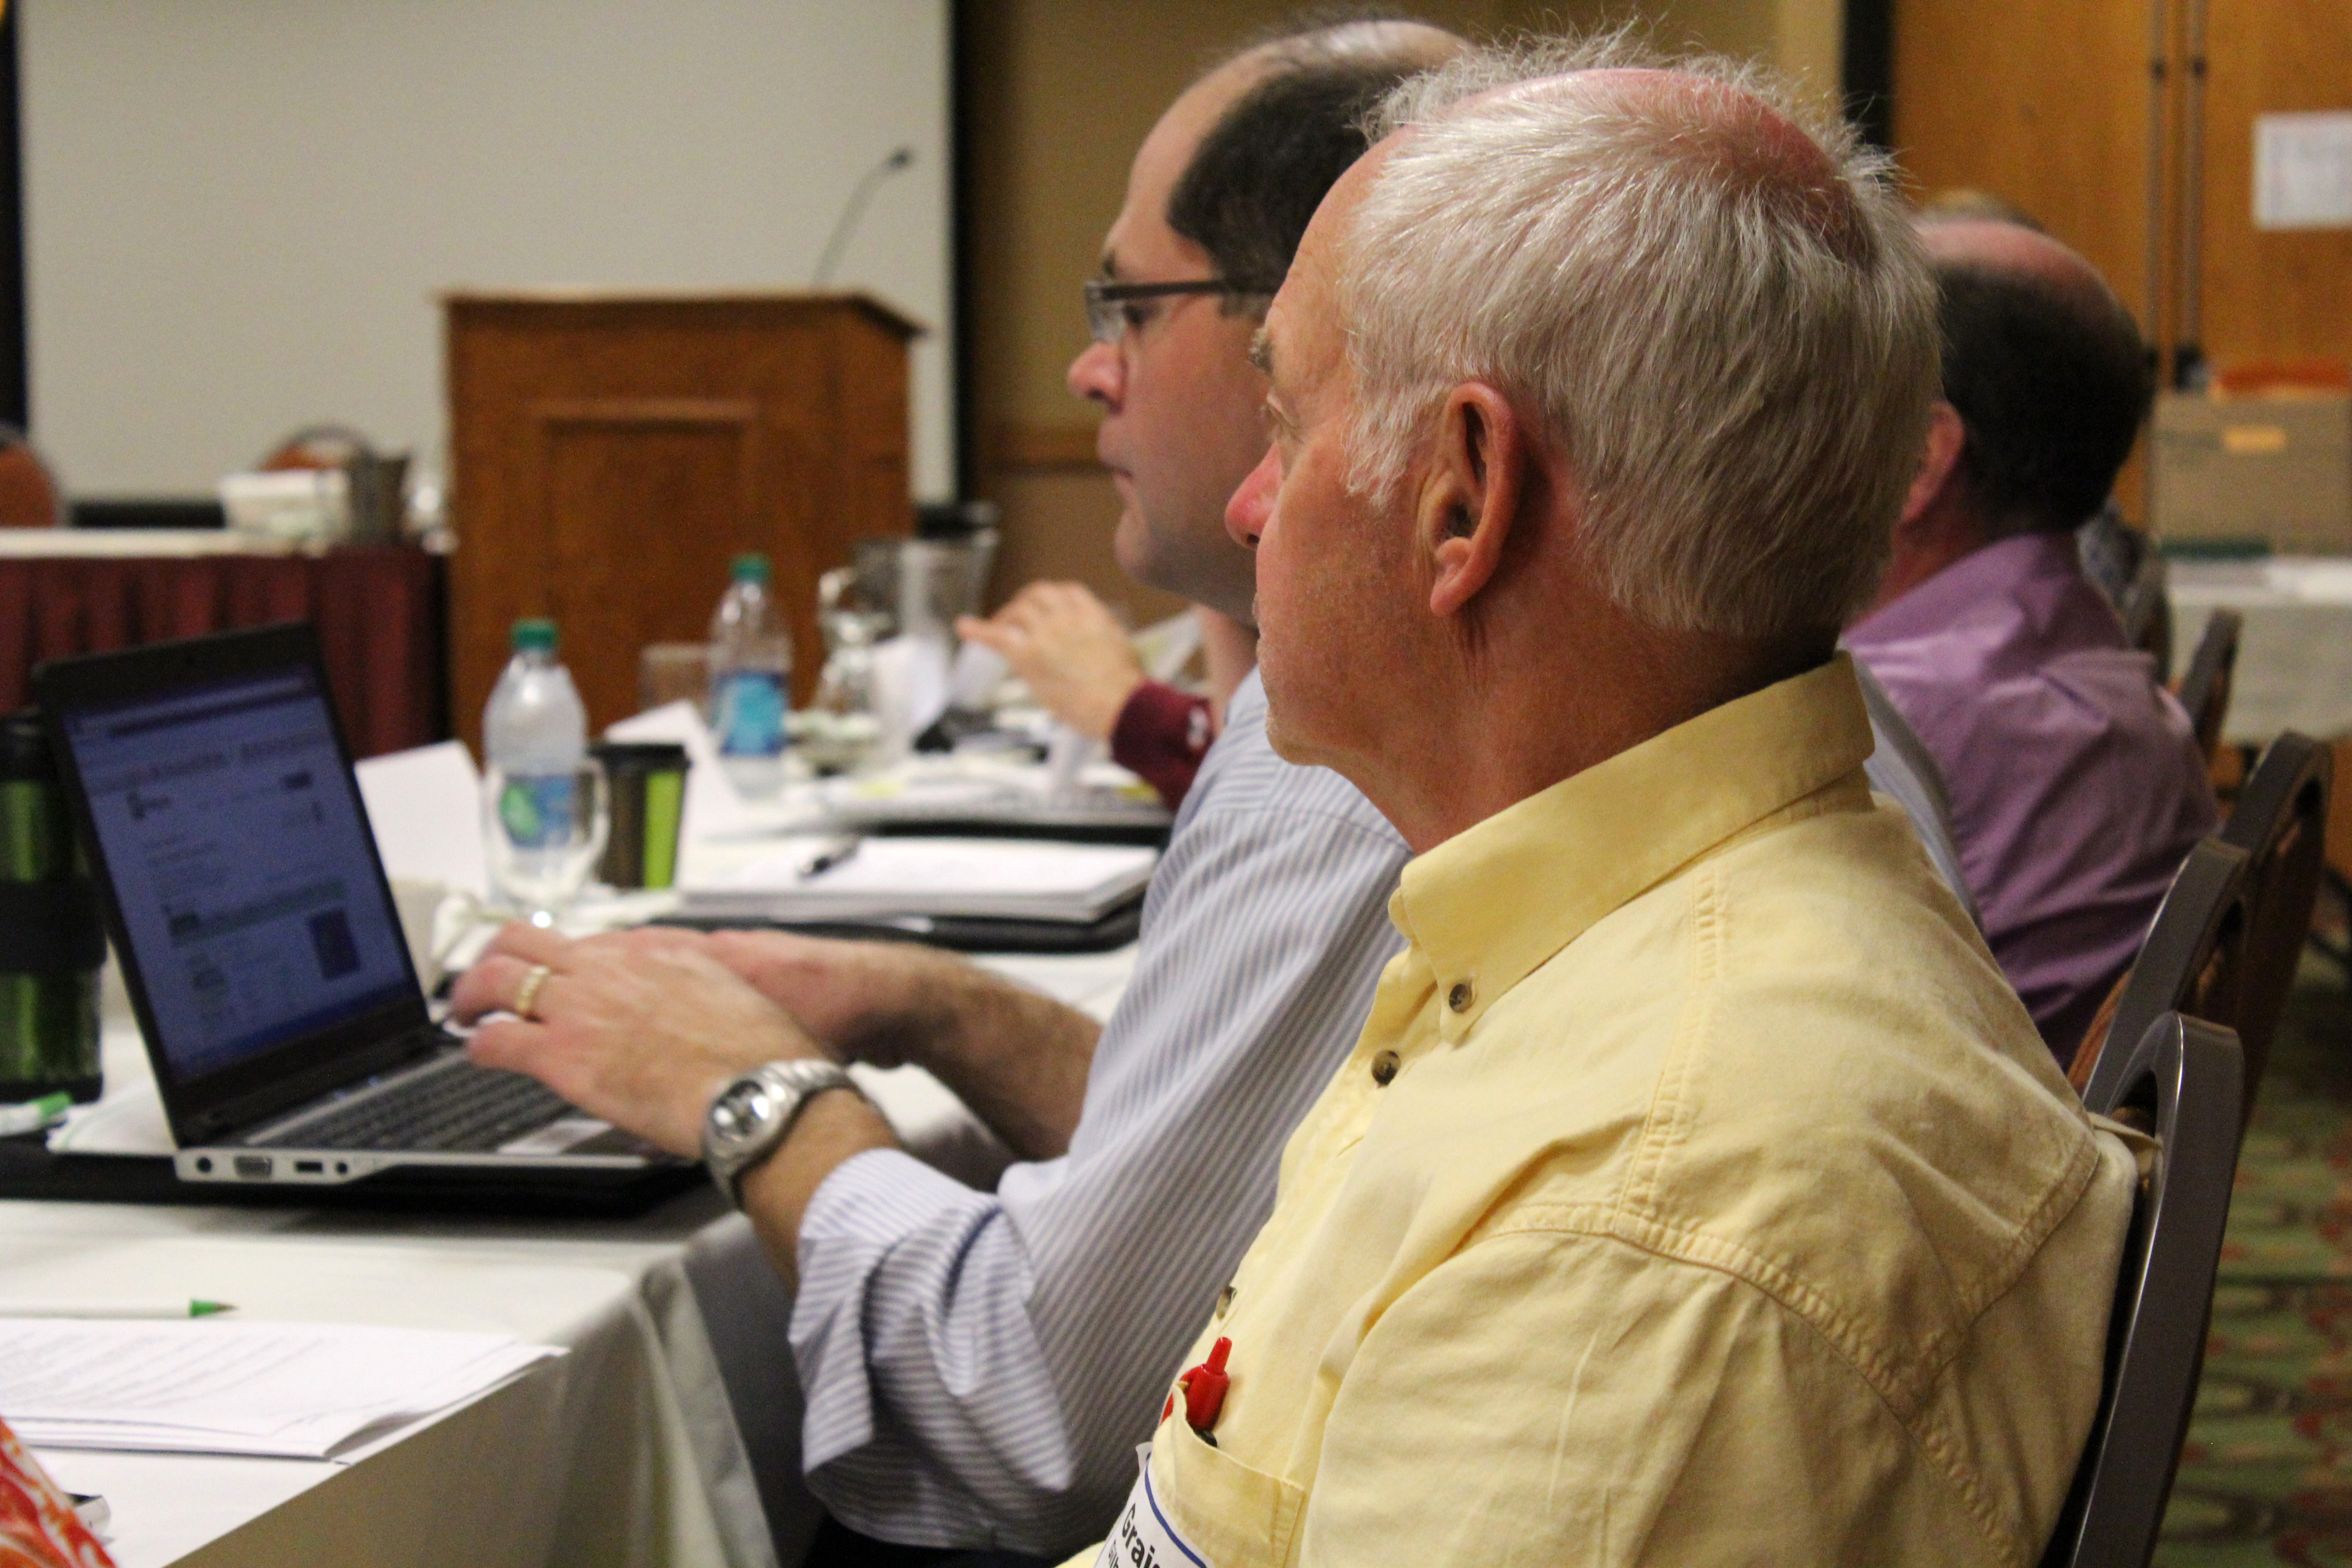
Participants at the three-day conference (June 10 to 12) are reviewing the findings of recent pooled fund studies, sharing their implementation experience and recommending what projects should be picked for the next round of research.
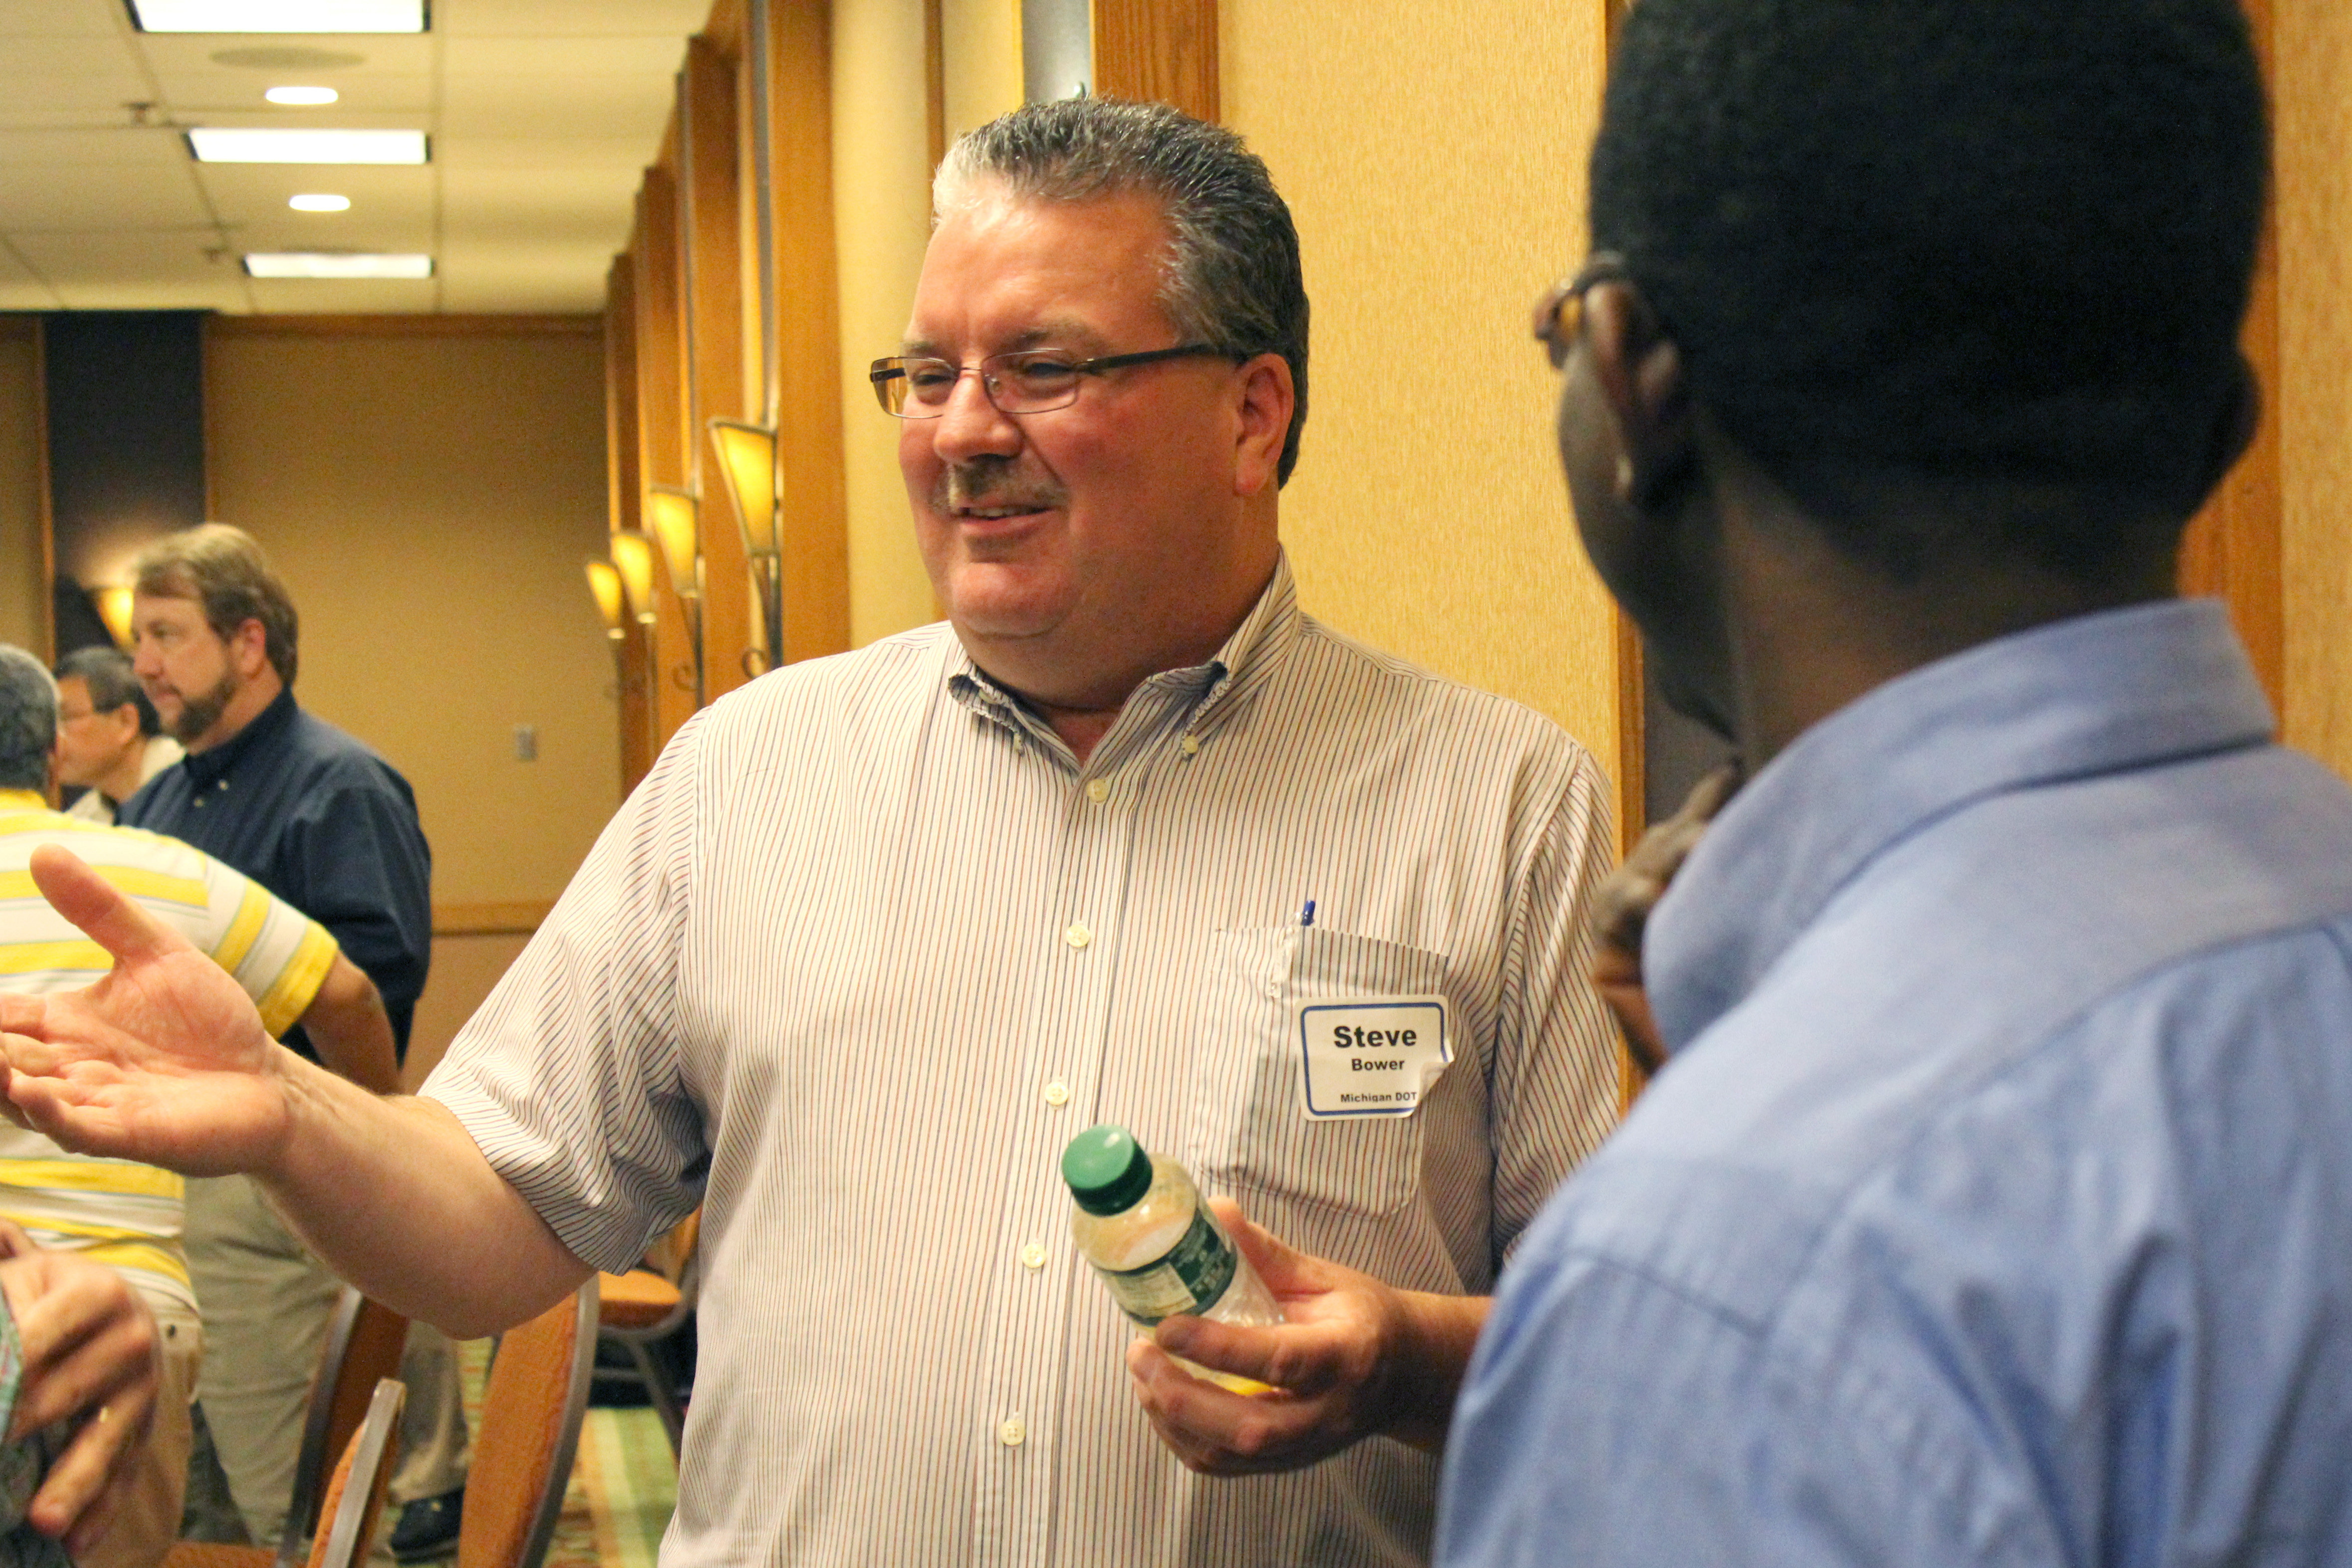
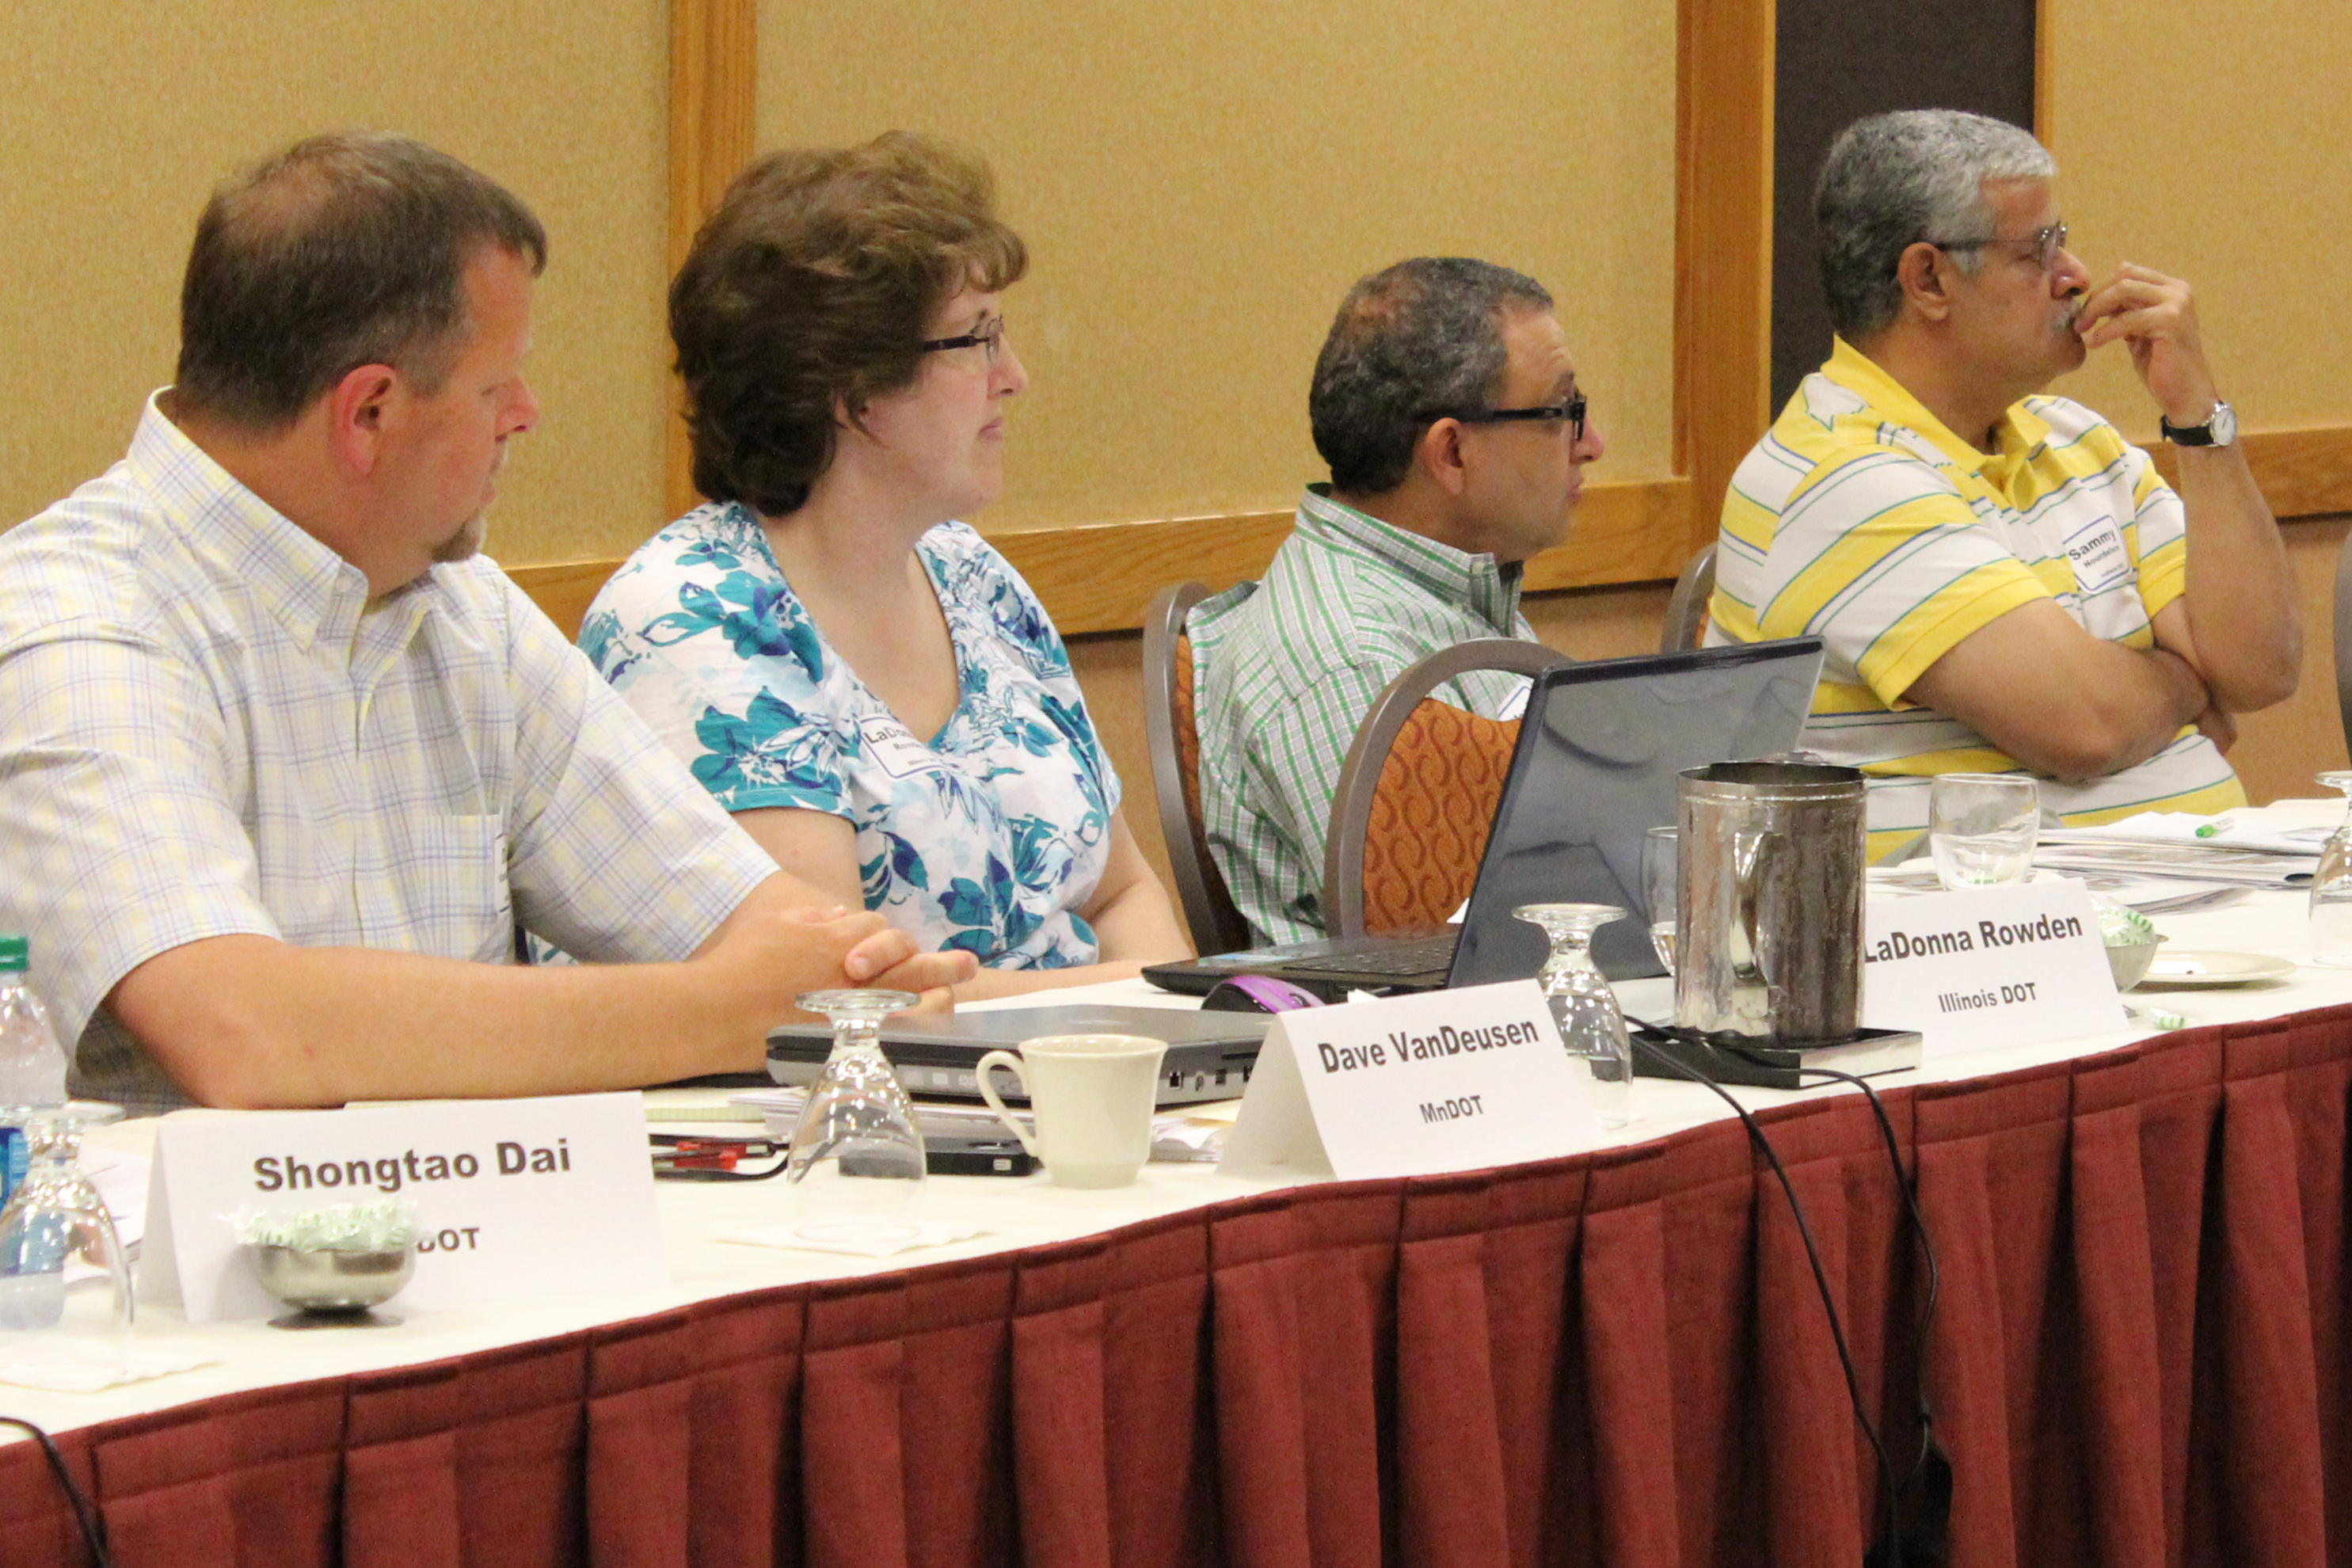
Bob Orthmeyer from the Federal Highway Administration said MnROAD is the only facility in the country that could supply several test sections needed for a recent study.Graig Gilbertson from MnDOT District 8 listens to one of seven presentations Tuesday on how agencies have implemented MnROAD’s second phase of research projects.Stephen Lee shares the Ontario Ministry of Transportation’s experiences during a discussion Tuesday on research implementation.Steve Bower, a Michigan Department of Transportation Research Engineer, visits with MnROAD researcher Bernard Izevbakhai, right, and other peers.Construction engineering professor Joe Mahoney, from the University of Washington, leads a group discussion on improving research efforts at the close of the session Tuesday.From left, Dave VanDeusen from MnDOT, LaDonna Rowden from the Illinois Department of Transportation, Magdi Mikhail from the Texas Department of Transportation and Samy Noureldin from the Indiana Department of Transportation.Researchers came from Missouri, Maine, Texas, Illinois, Michigan, California, Ontario, Wisconsin, Indiana and Washington for the three-day workshop.
We recently blogged about a research project to evaluate a new type of rumble strip that produces significantly less external noise than traditional designs. The above video, shot near Thief River Falls, Minnesota, shows a comparison between traditional rumble strip designs and the newer, “sinusoidal” rumble strips (a.k.a. “mumble strips”).
The life-saving benefits of rumble strips are well-established, but traditional designs produce external noise that residents consider to be a nuisance. The issue has pit safety concerns against quality-of-life concerns in some parts of the state. Researchers are investigating whether sinusoidal rumble strip designs, which are much quieter, are effective enough to combat drowsy or inattentive driving.
The video is not exactly a scientific comparison, but it does give the viewer a good sense of the difference in noise levels produced by the two styles of rumble strips. The results of the actual research project are expected to be available later this year.
Traffic signs provide important information to drivers, and are a critical component of traffic safety. In order to be effective, their visibility and readability must be maintained under both day and night conditions.
Key to signs’ effectiveness is a quality known as retroreflectivity — the ability for signs to bounce light back toward a driver’s eyes, making them appear brighter and easier to read. Retroreflectivity deteriorates with time, so transportation agencies need to actively maintain their signs.
A research project funded by the Local Road Research Board is developing a guide to help cities and counties better manage their signs, and also to meet a new Federal Highway Administration retroreflectivity management requirement while getting the lowest life-cycle costs.
Cities and counties have until June to establish a sign assessment or management method that will maintain minimum levels of sign retroreflectivity.
“Right now there’s a mixture of different management methods, with very little guidance as to what’s appropriate for your agency based on the signs you have and your labor force and equipment,” said Matt Lebens, a MnDOT research project engineer.
Since 1993, the Manual on Uniform Traffic Control Devices has included guidelines for minimum retroreflectivity of pavement markings and signs. The standards are meant to ensure that drivers, especially the growing population of elderly drivers, are able to detect, comprehend and react to traffic signs. The LRRB project is designed to help fill certain knowledge gaps in this area.
Measuring retroreflectivity
Possible methods for ensuring retroflectivity include night-time inspection; use of a reflectometer; spot-checking a sampling of signs that are the same age; or blanket replacement of signs once they reach a certain age.
Although the retroreflectivity of a sign is guaranteed by its manufacturer to last a certain number of years, it commonly lasts much longer.
“Currently, we don’t have expected sign life guidance for agencies to use. Through this project, we are establishing a control deck for sign sheeting used in the state, and an expert panel will make recommendations on expected sign life ranges,” Lebens said.
Researchers reviewed retro-reflectivity studies from other states and also measured the retro-reflectivity of signs out in the field across Minnesota using a retroreflectometer. As part of this project, MnDOT is providing training on the retroreflectometer and will also make it available for loan to local municipalities. (Watch a video demonstration.)
At MnDOT’s MnROAD site, control decks contain dozens of signs. In addition to measuring retroreflectivity, the MnDOT Materials lab is monitoring color fade, which has been a larger issue in Minnesota.
“By getting better data as to the real life in-field life span of the signs, agencies will have a more realistic and better informed value for sign life expectancy, as well as potentially reducing costs,” said MnDOT Senior Engineer Mark Vizecky.
Expected life
There’s been no definitive studies to date as to what the life of a sign is, said lead project investigator Howard Preston of CH2M Hill, but the research so far shows it is in well excess of manufacturer warranties.
Cities and counties will be advised to pick an expected sign life that goes beyond the warranty – and then stay tuned.
“The notion is to watch these signs until they fail,” Preston said. “The sheeting material is better than it used to be. The failure might be 20 or 30 years out.”
There are two basic types of reflective sheeting material: beaded and prismatic.
Although beaded is guaranteed to last 10 years, researchers anticipate a retroreflectivity life of between 12 and 20 years old.
For the prismatic material – which has a 12-year warranty – the life cycle is anticipated to be 20 to 30 years.
“Nobody knows for sure, because nobody has actually followed this material to failure in a controlled condition,” Preston said. “On the road, there are so many variables: vandalism, knock-downs, etc.”
Researchers look at the test deck at MnROAD. The study panel includes city and county engineers.
Despite their more similar roles at work and home than ever before, U.S. men and women continue to have different travel behavior. Historically, employed men have spent more time traveling to work and less time on household and family support trips than women. While this difference is well-documented, explanations for the difference vary widely: some theories say it’s due to biologically driven differences in gender, while others attribute it to socially constructed gender roles or to gendered structural contexts such as labor market segregation and economic inequality.
While much research has examined these theories, few studies have tested their validity based on evidence—which prompted U of M researchers to examine the theories more deeply. “We believe a greater understanding of the underlying reasons for these enduring travel differences is necessary to effectively address the gender equity issue in transportation policy,” says Yingling Fan, assistant professor in the U’s Humphrey School of Public Affairs.
Researchers set out to test the competing theories by analyzing publicly available data from the American Time Use Survey (ATUS) in various ways across groups of workers with different types of family structures. (ATUS is an ongoing time diary study funded by the U.S. Bureau of Labor Statistics.)
First, they tested the theory that travel behavior differences were based on biologically driven gender differences. “If this theory was true, travel differences between men and women could be applied across all population groups regardless of family structure, but this was not the case,” Fan explains. “We found that single female workers and single male workers exhibit no significant difference in travel behavior.”
Next, the team studied the impact of gendered structural contexts, such as women’s greater presence in pink-collar occupations and significantly lower earnings. The team found moderate support for this theory. “These factors are associated with shorter work travel time among some—but not all—family structures,” Fan says.
Researchers did find strong support, however, for the theory that socially constructed gender roles explain travel behavior differences. “We discovered that while marriage alone doesn’t differentiate travel behavior between men and women, parenthood does have a significant impact,” Fan says. “Interestingly, we found that even being the sole breadwinner does not insulate mothers from socially constructed gender roles—female breadwinners in married single-worker households with children have shorter work commutes and more household support travel than male breadwinners in the same family structure.”
According to the researchers, these findings have important implications. First, policies to minimize auto travel (for environmental purposes, for example) may be unfair to women who wish to reach more job possibilities through longer commutes. In addition, the findings highlight the importance of incorporating parenthood as a prime variable in understanding the gender and mobility connection.
Finally, this research provides insights on how future growth or decline in specific family structures may shape travel demand. “As childless households continue to grow in relation to households with children, it’s possible that fewer female workers will be confined by short work commutes and may choose to spend more time commuting to more desirable jobs, placing new demands on the transportation system,” Fan says.
The research was funded in part by a Minnesota Population Center Program Development Grant.
Reprinted from the May 2014 issue of CTS Catalyst.
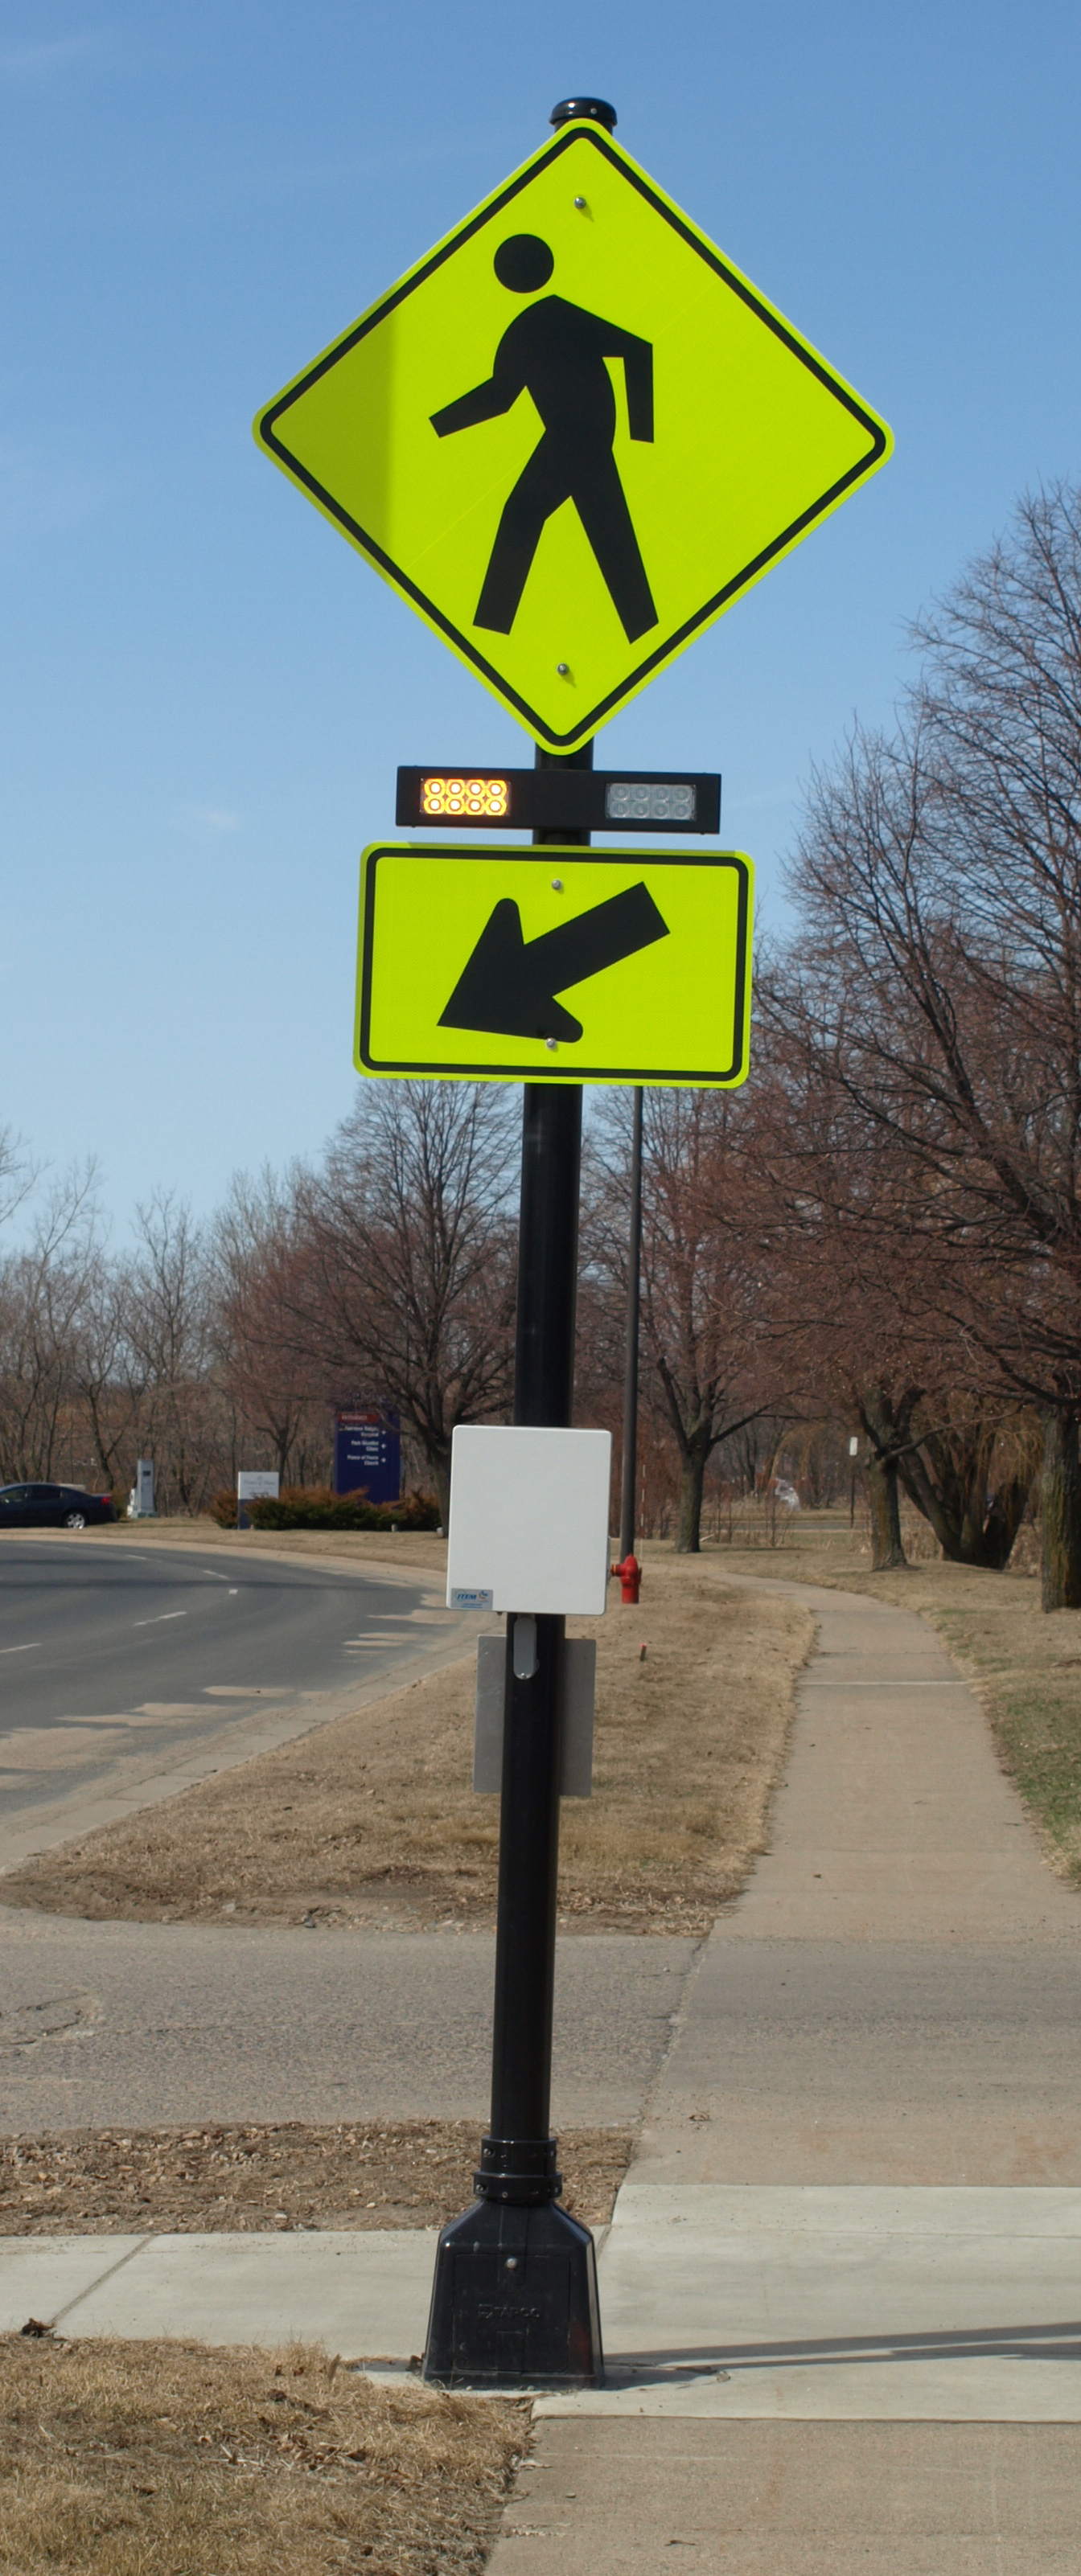
City and county engineers often struggle with how to respond to safety concerns about pedestrian crossings, with no scientific method for evaluating them.
In Long Lake, for example, the police department received numerous complaints about the safety of a particular pedestrian crossing. But when the crossing was videotaped, no one was observed using it.
This example — which was part of a research project funded by the Local Road Research Board — exemplifies the difficulties local governments face when they receive requests for a stop sign or signals at a crossing.
The soon-to-be released guidebook* recommends when to install marked crosswalks and other enhancements based on the average daily vehicle count, number of pedestrians, number of lanes and average vehicle speed. It guides users how to rate a crossing for pedestrian service, and includes a flow chart to assist in decision-making.
The training is unique because it is based on actual video footage of existing crosswalks and the pedestrians which use them.
No guidance
Although vehicles are legally required to stop for pedestrians crossing at intersections and within marked crosswalks, they don’t always yield the right-of-way. And areas with high traffic volumes may not have adequate gaps for pedestrians to cross safely, leading to risk-taking.
Alan Rindels, a MnDOT research engineer, had previously looked for a methodology to evaluate a crosswalk’s effectiveness, but could not find an appropriate engineering analysis.
“What I kept coming up with were results based on the experience of an engineer or planner for what they ‘felt’ was a better crosswalk, such as additional pavement markings, lights or maybe a signal system,” he said.
Rindels finally found guidance in a Transportation Research Board webinar two years ago. Based on that, he asked the LRRB to develop a training methodology for Minnesota practitioners.
Uncontrolled pedestrian crossings
Unless specifically marked otherwise, every intersection is a pedestrian crossing, regardless of the existence of crosswalk markings or sidewalks. At mid-block locations, crosswalk markings legally establish the pedestrian crossing. Uncontrolled pedestrian crossings (which the guidebook focuses on) are locations that are not controlled by a stop sign, yield sign or traffic signal.
Defining where to place pedestrian crossing enhancements — including markings, signs and or other devices — depends on many factors, including pedestrian volume, vehicular traffic volume, sight lines and speed.
The LRRB developed a worksheet that engineers can use to evaluate an uncontrolled pedestrian crossing location in a systematic way, in accordance with the 2010 Highway Capacity Manual. Users note the level of lighting, distance from the nearest all-way stop and whether another location might serve the same pedestrian crossing more effectively.
The guidebook’s 11-step evaluation can identify what level of treatment is appropriate, ranging from overhead flashing beacons and traffic calming devices, such as curb bump-outs, to more expensive options like building overpass or underpass.
Hennepin County Senior Transportation Engineer Pete Lemke, who went through pre-training, said the guidebook will help engineers measure the pedestrian experience by “quantifying the delay at non-signalized intersections.”
“It will inform how we respond to concerns — whether that response is ‘the crossing fits the needs of what’s there’ or ‘we need to make changes or enhancements,'” he said.
Further Resources
Putting Research Into Practice: A Guide for Pedestrian Crossing Treatments at Uncontrolled Intersections – Technical Summary (1 MB, 2 pages); Final Report.
* Consultant Bolton & Menks prepared the guidebook with guidance from a 21-member project team that included University of Minnesota researchers and engineers from the city of Eagan, Hennepin County, Carver County, Scott County, MnDOT, the Center for Transportation Studies and the Federal Highway Administration.