The only way to test pavements is to destroy them — slowly and painstakingly, one moving vehicle at a time. At MnROAD, the state’s world-renowned pavement research facility, the bulk of this monotonous-but-necessary work is performed by live traffic passing through Albertville on I-94. But on the facility’s 2.5-mile low volume road test track, which simulates rural road conditions, more controlled methods are preferred.
Doug Lindenfelser is one of several MnROAD employees who take turns driving an 80,000-pound semi tractor trailer in laps around the closed-loop low-volume track. The truck is loaded to the maximum allowable weight limit on Minnesota roadways. As it passes over the facility’s 23 distinct low-volume test cells, an array of sensors capture data on the pavement’s performance, which researchers then use to design stronger, longer-lasting roads. The truck only drives on the inside lane; that way, the outside lane can be used as an “environmental lane” to compare damage caused by loading vs. damage caused by environmental factors.
He has other duties as well, but on a given day, Doug might drive the truck 60 or 70 times around the low-volume road test track. It might not sound very exciting, but as Doug explains, some days his job can be quite interesting. We interviewed him on camera during a recent visit to MnROAD. The resulting video is available above and on our YouTube channel.
For those who might be wondering, all this diligent destruction of pavement has paid off. It is estimated that MnROAD’s first phase of research (from 1994-2006) has resulted in cost savings of $33 million each year in Minnesota and $749 million nationally. Cost savings from its second phase (2007-2015) are being calculated, and the facility is scheduled to enter its third phase in 2016.
As public works employees come and go, past research efforts — and the valuable knowledge gained — often goes with them.
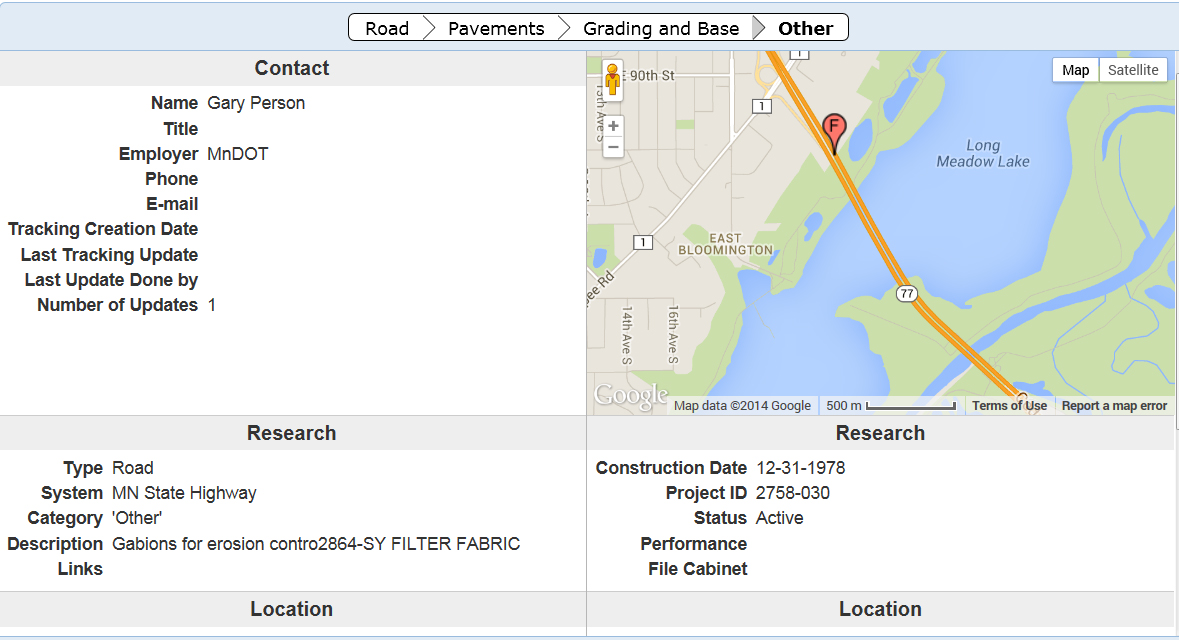
But a recently launched web application allows users to track innovative pavement projects for a lifetime.
“It’s something everyone has always said we need to have,” said MnDOT Research Operations Engineer Jerry Geib, who worked on the project for the Minnesota Local Road Research Board.
Using an online map, city and county engineers can enter road test sections that they want to observe for many years due to a particular construction method or material that was used. Too often, the knowledge about such projects is lost when a particular staff person leaves an agency.
Not only will the lessons learned be remembered within the organization, but the results can also be shared with others.
More than 1,400 projects (including some on state roads) previously identified by MnDOT have been entered into the system. Search fields allow users to look for a particular type of project anywhere in the state or they can zero the map in on a particular area of the state.
The website is still in beta form, but functional.
“It’s complete, we just want people to use it so we can improve it,” said MnDOT Research Project Engineer Melissa Cole, who began planning the site two years ago.
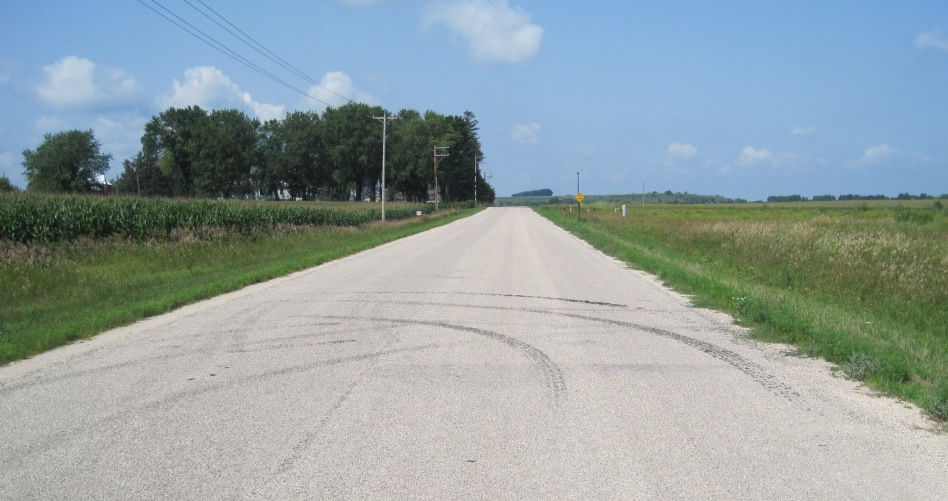
One featured project is a 1.8-mile section of dirt road in Wabasha County that had an Otta seal applied in 2007 (photo below). It is one of only a handful of lightly surfaced roads in the state (an improvement over a gravel road, but less expensive than asphalt ) so there is great interest in watching how it performs.
One of the projects being tracked is Wabasha County Road 73, one of only a handful of lightly surfaced (Otta seal) roads in the state.
More to come
The LRRB initiated the project in 2009, but it was put on the back burner for a while due to funding constraints. MnDOT ‘s technology staff began development of the current site about 11 months ago.
Anyone can look at the website, but cities and counties require permission to post projects (contact ResearchTracking.DOT@state.mn.us for credentials). They can upload photos, plans and weblinks relating to a particular project.
“We want to track anything that is worthy of looking at a few years from now,” Geib said.
Because the website uses Google maps, users can also view archived satellite and ground-level 360-degree imagery of the roads and bridges.
The website is viewable on a tablet, but it still must be tested on smart phones. Developers hope that crews will be able to submit information right from the field.
“We’re pretty happy with it,” said MnDOT software developer John Jones. “We think we’re headed in the right direction.”
The website might eventually be expanded for other areas, such as geotechnical (foundation work), whose practitioners have already expressed an interest.
A rumble strip applied to a center line on Highway 14 near New Ulm in 2004 is one of the projects being tracked.
Using Dawn dish soap to grease the rails, MnDOT crews inched the new Larpenteur Avenue Bridge into place two weeks ago using an innovative construction method.
As the bridge reopens to traffic tonight over I-35E, MnDOT celebrates the success of its first slide-in place bridge construction.
“The slide-in worked very well,” said David Herzog, MnDOT’s project manager for the I-35E Corridor – MnPass Project. “I think the process has given us the confidence to possibly use it again in the future.”
Slide-in technology
The slide-in method has been used in the past for railroad bridges and large bridges with high traffic and limited construction options. Now, state agencies and the Federal Highway Administration are applying the method to smaller, more routine bridges to minimize impacts to the traveling public.
Whereas the typical phased construction of a bridge builds one-half of the structure at a time, slide-in bridge technology allows the entire superstructure to be built at once, requiring just a brief, temporary closure of the highway.
Crews constructed the 3.5-million-pound Larpenteur Bridge right next to the existing bridge and then slowly slid it into place during the course of two nights. This effectively sped up construction from 110 days to 47 and reduced traffic impacts to drivers. (Watch video of the slide.)
The quality of the bridge also improves with this method, since it eliminates the deck construction joints and girder camber problems associated with phased construction, according to the FHWA. The pressure to use faster concrete cure times is also reduced.
History
With a quarter of the nation’s bridges in need of repair or replacement, the FHWA is pushing the slide-in method as a cost-effective technique that can cut construction time in half. It has previously been used in Oregon, Utah, Missouri, Michigan, Colorado and Massachusetts.
The concept has been around for more than a century, but slide-in technology is relatively new for small or medium-sized bridges, and it’s the first time MnDOT has attempted it on a state bridge.
Although MnDOT staff had flown out to Utah to view a slide-in, it was Burnsville-based Ames Construction that proposed reconstructing the Larpenteur Avenue bridge that way when it made its successful bid for the corridor project.
The slide-in method is about 15 percent more expensive, Herzog said, but it allowed the bridge to re-open in 47 days, versus 110 days.
Earlier this summer, Ames replaced the Wheelock Parkway and Arlington Avenue bridges in conventional fashion, although they were only closed for 65 days because they were constructed on a very accelerated timetable.
“Larpenteur is more of a major thoroughfare and we thought shortening the duration of its closure would be more valuable to MnDOT,” said Steve McPherson of Ames Construction, who was brought in from Utah to oversee the corridor project.
The fast reconstructions will allow the company to complete the bridge replacements and highway reconstruction in just 120 days. Next year it’ll finish the other half of the corridor.
All three bridges are being replaced to make room for the new MnPASS lane on I-35E.
One of the drawbacks to slide-in technology is that it requires ample room to build the bridge on-site. An alternative is to construct off-site.
The new Maryland Avenue/I-35E bridge was built off-site, as was the Hastings Hwy. 61 bridge. It was then loaded onto a barge, floated down the Mississippi River and lifted into place.
Aging roads and bridges, increased traffic and persistently constrained revenues put local road systems in peril, but the public is largely unaware of the pressures facing their communities, a Minnesota Local Road Research Board study has found.
The LRRB undertook the study to identify critical gaps in public knowledge about local road system challenges and to develop communication methods and tools to address these shortfalls.
Researchers found that even elected officials are unaware of the gap in funding needed to keep the road system going — in part because county engineers have been creative in a period of dwindling resources, and the cost of deferred maintenance has not been immediately visible.
In fact, only one Minnesota news outlet specifically covered the issue of local road system sustainability in a five-year period analyzed by researchers, with media coverage focused mainly on big events, like the collapse of the 35W bridge and the federal transportation funding bill.
There are multiple challenges to road system sustainability, including rising construction costs, declining tax revenues, heavier agricultural and industrial equipment and rising public expectations.
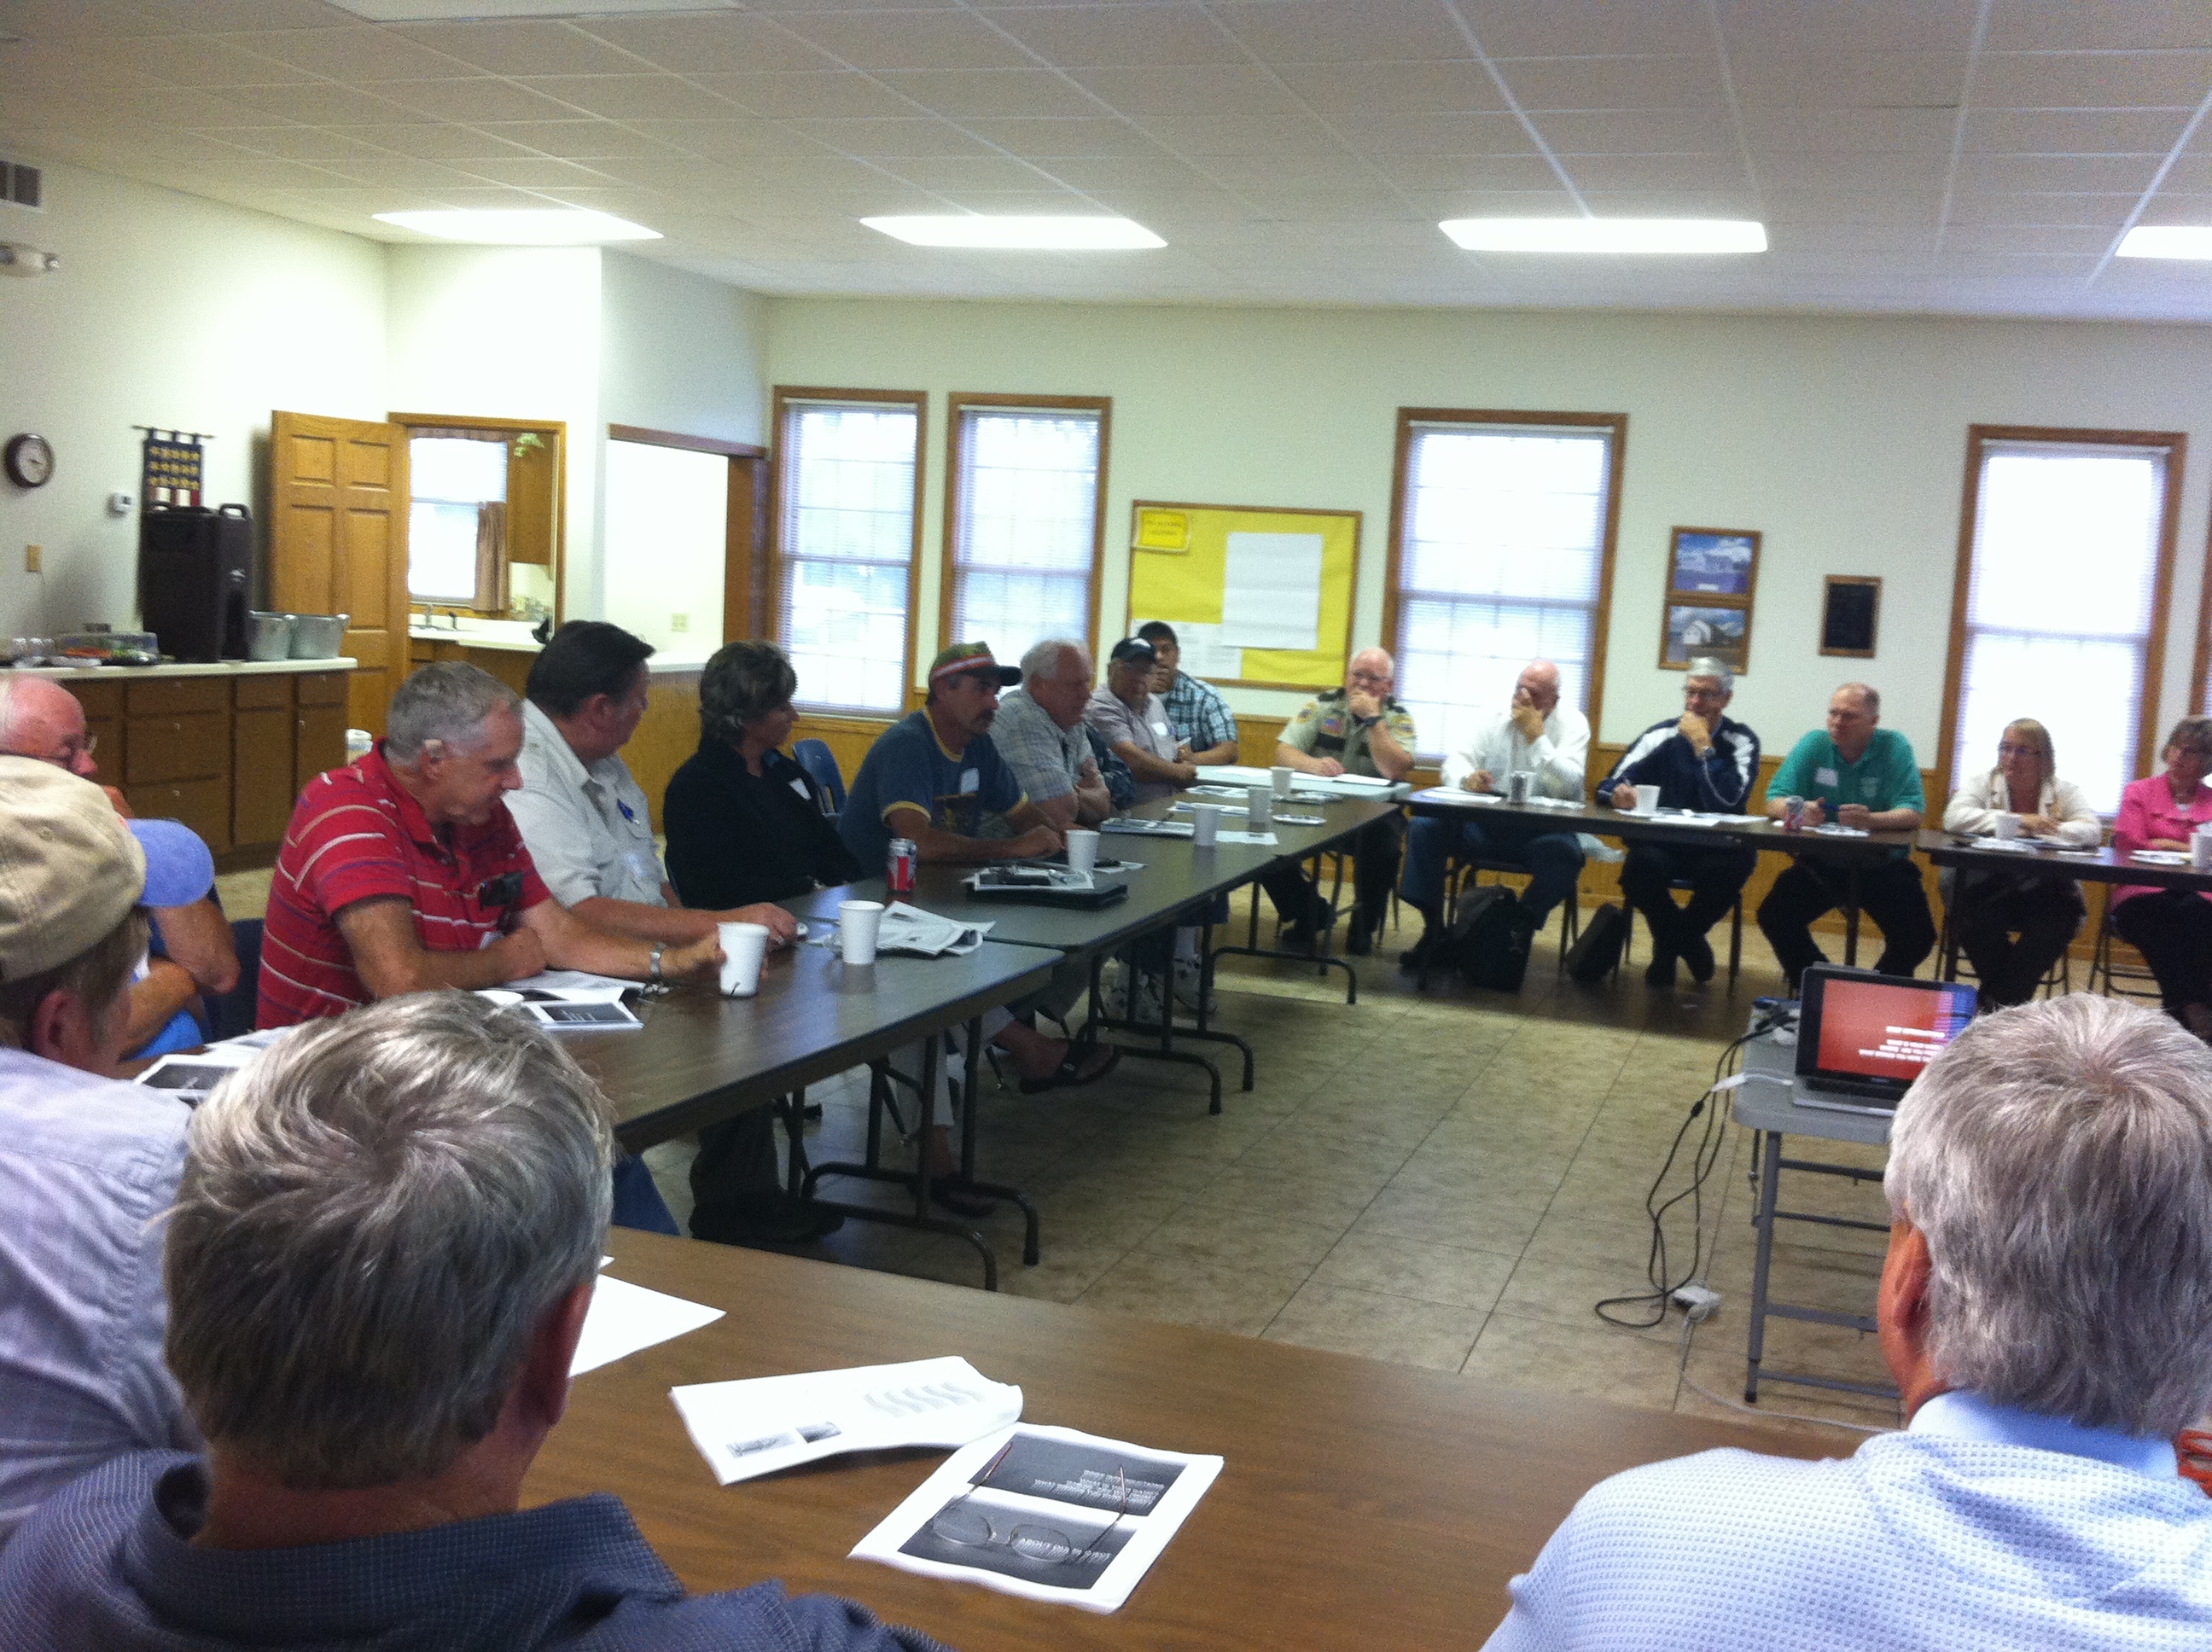
In Beltrami County, researchers facilitated focus groups and round-table discussions regarding competing alternatives for revitalizing the county’s road system. (Photo by Guillermo Narvaez)
Education needed
To help county engineers better educate the public, researchers looked at outreach strategies (such as open houses and focus groups) currently used in three Minnesota counties: Beltrami, Dakota and Jackson. The research team talked with county road managers to identify key issues and concerns and surveyed 91 residents who had participated in public engagement efforts.
The project revealed widespread confusion about local road system issues. For example, many participants erroneously believed that the gas tax covers (or was enacted to cover) the cost of maintaining local roads.
Researchers have produced a set of recommendations and tools for county engineers to use in designing effective public engagement processes that overcome confusion and a lack of information. A newly approved follow-up project will test the tools in three or four other Minnesota counties and cities.
Note: This article was adapted from the July-August 2014 issue of our Accelerator newsletter. Sign up for your free print or email subscription by clicking here.
It’s old news already, but any blog about transportation research and innovation in Minnesota would be remiss if it didn’t mention this amazing video of MnDOT workers sliding the new Larpenteur Avenue Bridge into place late last week.
The slide-in method is an accelerated bridge construction technique that allowed MnDOT to speed up the project and cut the the amount of time the bridge will be closed by more than half. It’s also cheaper and safer. This project marks the first time the slide-in method has been used in the state.
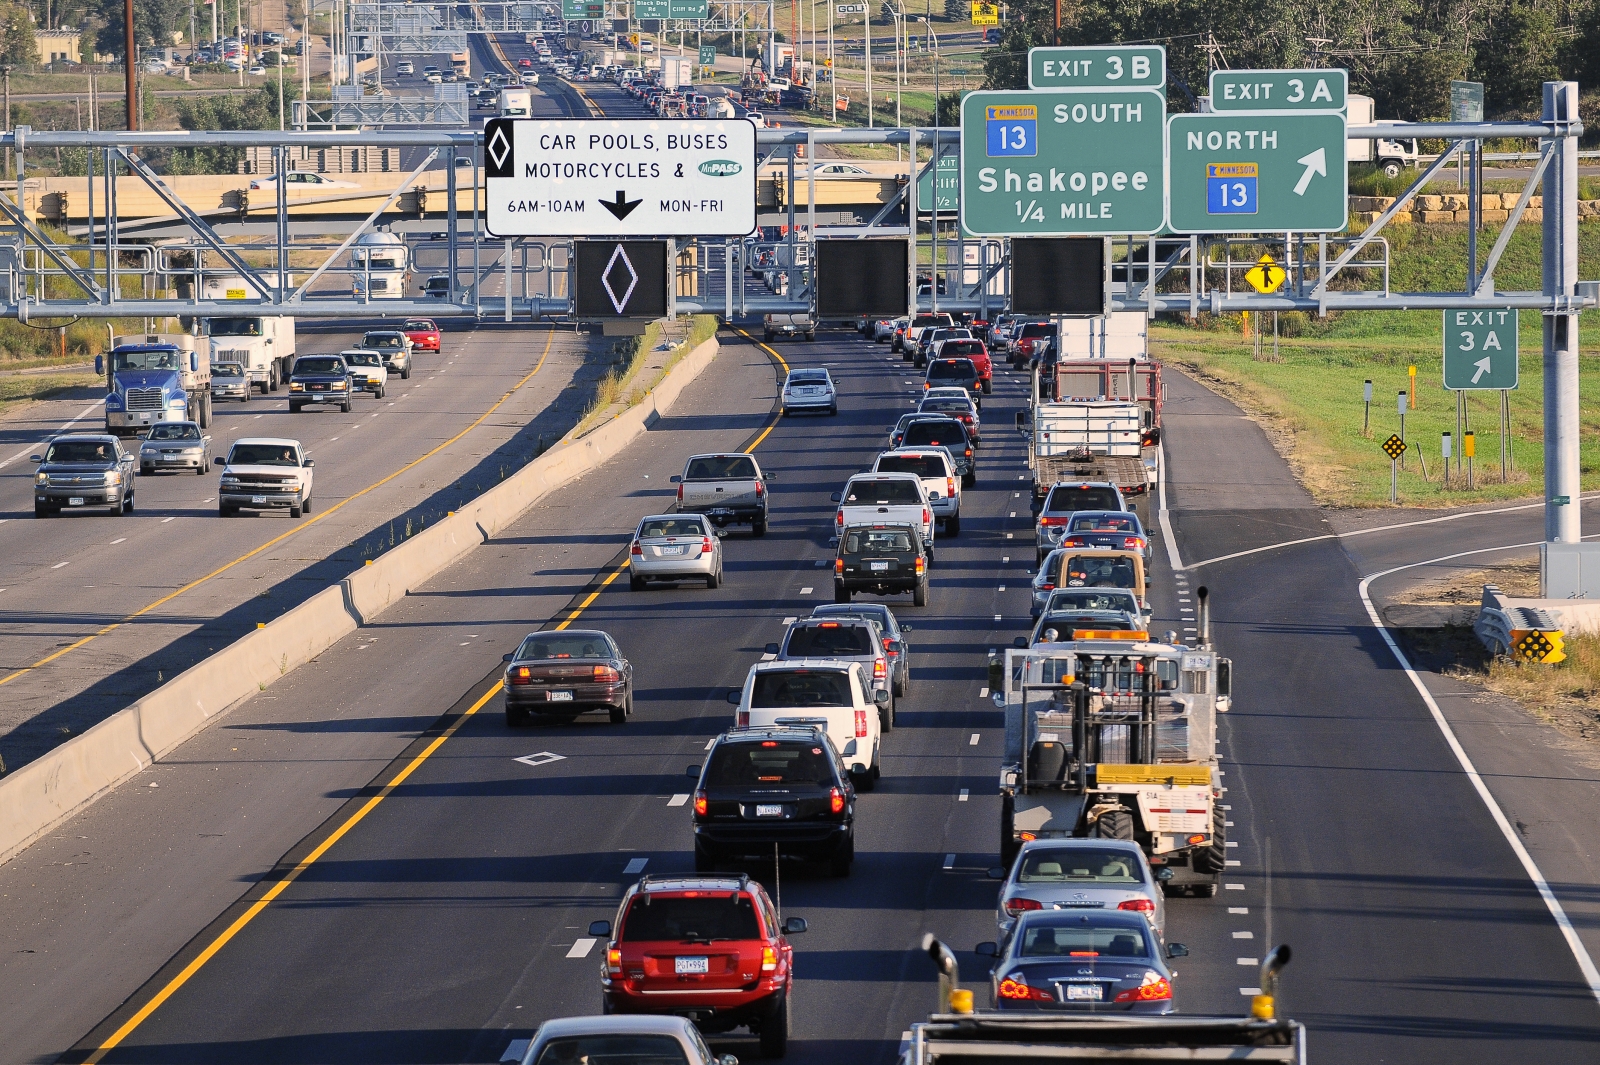
I-35W’s MnPASS lane, where vehicles can frequently enter and exit the high-occupancy toll lane, is just as safe as the MnPASS lane on I-394, where motorists only have a few shots to enter the system, a new study finds.
Researchers at the Minnesota Traffic Observatory undertook the MnDOT-funded study because of objections to open systems like the one on 35W.
“The federal government has very strong arguments against the open system. They’re saying it’s going to be dangerous – cause more disruption and more congestion,” said John Hourdos, director of the Minnesota Traffic Observatory. “We found that both roadways are working very well today because they were designed appropriately for their location.”
The definition of an open system is one that has more opportunity for access than restriction. On 35W, a dotted white lane means vehicles can enter the toll lane at will, and a solid line bars access.
Vehicles must have two occupants on-board or an electronic pay card to use the express lanes during rush hour.
MnPASS on Highway 35W.
The reason I-35W allows vehicles to enter MnPASS more frequently than I-394 is because there are more ramps where new vehicles are entering the freeway and might want to get on MnPASS.
Researchers studied whether accidents are more likely to occur by studying the number of accident-inducing vehicle movements along the 35W corridor. They found that areas where accidents are mostly likely to occur are also where the lane would have to allow access anyway under a closed system like 394.
The study also looked at mobility, determining that MnPASS users have just as good free-flowing traffic under the open system.
Helpful tools
Researchers also created design tools that engineers can use to determine where access points should be on MnPASS lanes.
Until now, engineers have relied on rule of thumb. For example, the general guidance for allowing access on a closed system was 500 feet for every lane between the entrance ramp and the HOT.
The tools can be used to automatically determine how fluctuations in the MnPASS fee will affect congestion within the lane.
The fee to use MnPASS depends on the time of day.
As the express lane become more congested, the fee to use it increases. This slows the number of cars entering the lane, increasing the speed of the vehicles already in the lane.
“We ran the tool on three locations on 35W and found that, for example, on Cliff Road, you can increase the traffic by 75 percent and still be okay,” Hourdos said. “You have more leeway there than north of the crossroads of Highway 62 and 35W, for instance.”
Related Resources
MnPASS Express Lanes: Open or Closed Access? — Technical Summary (PDF, 1 MB)
Two years ago, MnDOT installed a series of electronic speed limit advisory signs over Interstate 94 between Minneapolis and St. Paul. The Variable Speed Limit (VSL) system is designed to reduce congestion and help prevent crashes by recommending lower speed limits to motorists during periods of high traffic.
The new technology has worked in other places, including China and Germany. In Minnesota, a similar VSL system on I-35W reportedly had moderate benefits in reducing the total amount of congestion during the morning commute south of Minneapolis.
Although the verdict on I-94 congestion is still pending, a newly released study has found that the new system has not made a measurable impact so far on crashes in an accident-prone stretch of freeway in downtown Minneapolis. Why not?
University of Minnesota researcher John Hourdos has a few theories.
One is a simple time lag in the congestion reporting system. Another is a requirement that all lanes display the same speed limit, which he said causes confusion when only one lane is actually congested. The complexity of the I-94 commons also appears to be beyond what the VSL system was designed to do. And according to Hourdos, one of the most significant problems is the driving public simply doesn’t understand what the signs are telling them.
“People do not know what the system really does,” Hourdos said. “There hasn’t been much education on it other than a couple of news articles over the years. And when they try to decipher it on their own they get even more confused.”
The I-94 Commons area has a major bottleneck where the I-35W northbound ramp merges with I-94 westbound (between Cedar Avenue and 11th Avenue). Vertical red lines indicate locations of gantries that display variable speed limit advisories.
The advisory speed limits are posted in response to varying traffic conditions. As vehicles approach the commons area, the system measures speeds at the bottlenecks. If the traffic slows, the system transmits a reduced advisory speed to drivers approximately 1.5 miles upstream from the location of the slow-down.
Hourdos said many motorists mistakenly believe the speed displayed on the signs is either a reflection of the speed on the current stretch of highway or an indication of the speeds on the highway ahead, rather than a suggested speed for them to follow.
The requirement to display the same speed limit on all signs also compounds the problem, Hourdos said, because when drivers see that the slowdown is only occurring in certain lanes they tend to ignore the signs altogether.
“In the lane that is congested, the real speeds drop much faster than what the VSL system can respond to, reducing the functionality of the system to the eyes of the drivers,” Hourdos said, “while on the fast-moving lanes, it seems the system has no purpose at all.”
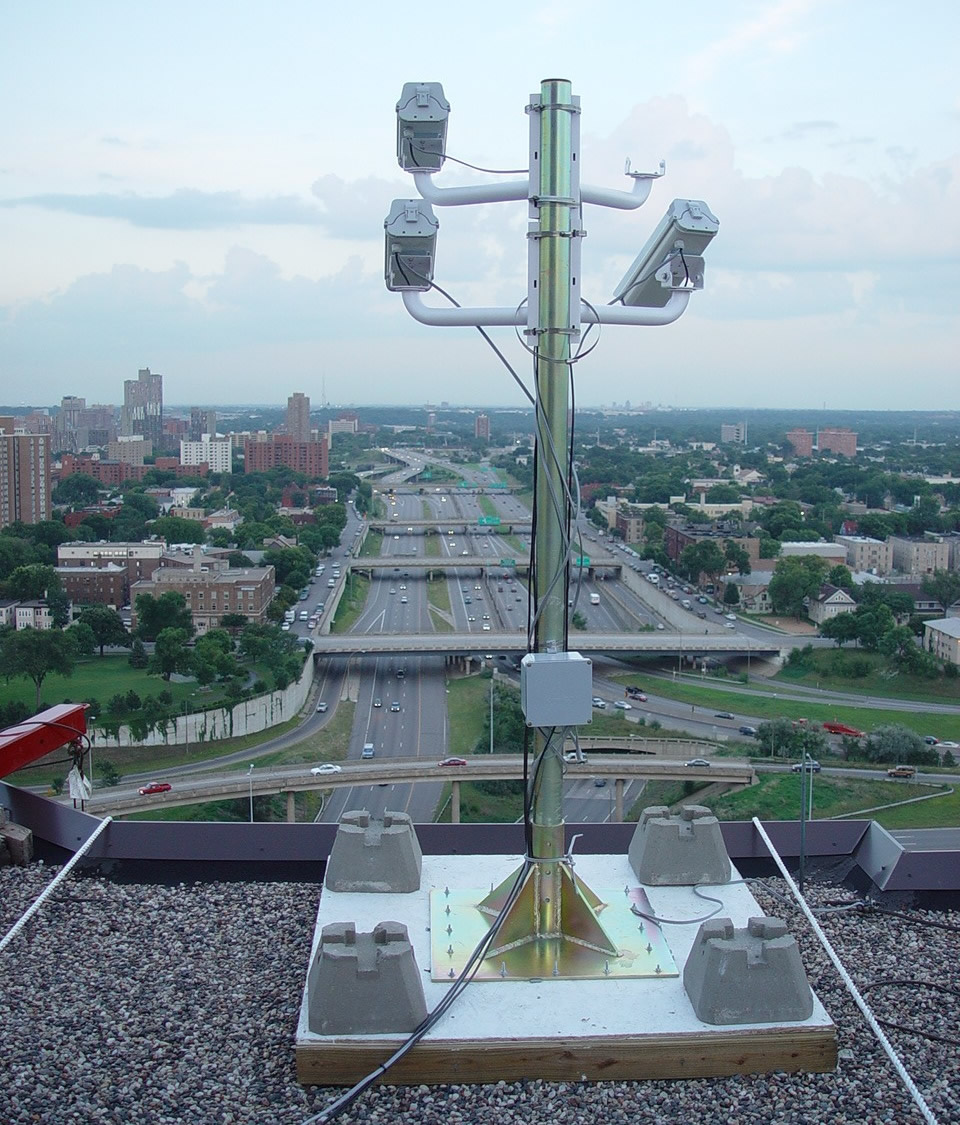
Data was primarily collected via cameras at the I-94 Commons’ Third Avenue Field station, overlooking an area with a particularly high crash rate.
So is the I-94 VSL system useless? Not necessarily. For one, the new study didn’t measure the system’s impact on congestion — only its ability to reduce crashes on a small portion of I-94. Moreover, the area in question, the I-94 Commons, is fairly unique, having two major bottlenecks, the highest crash rate in the state (nearly one every other day), and five hours of congestion during the afternoon rush hour alone.
“The VSL system was designed for implementation on any freeway and may not have been well-suited for the I-94 Commons area, which is a very complex corridor with high volume weaves and significant shockwave activity,” said MnDOT Freeway Operations Engineer Brian Kary.
Generally speaking, the VSL system was designed to identify slow traffic ahead of where free-flowing traffic is approaching slow or stopped traffic.
“The crash problems within the commons are caused by speed differentials between lanes and shockwave activity within the congestion,” Hourdos said. “The current VSL system was not developed to handle these types of conditions.”
MnDOT and the researchers aren’t giving up, either. A new project is starting later this year to develop and deploy a queue warning system specifically for this high-crash rate location.
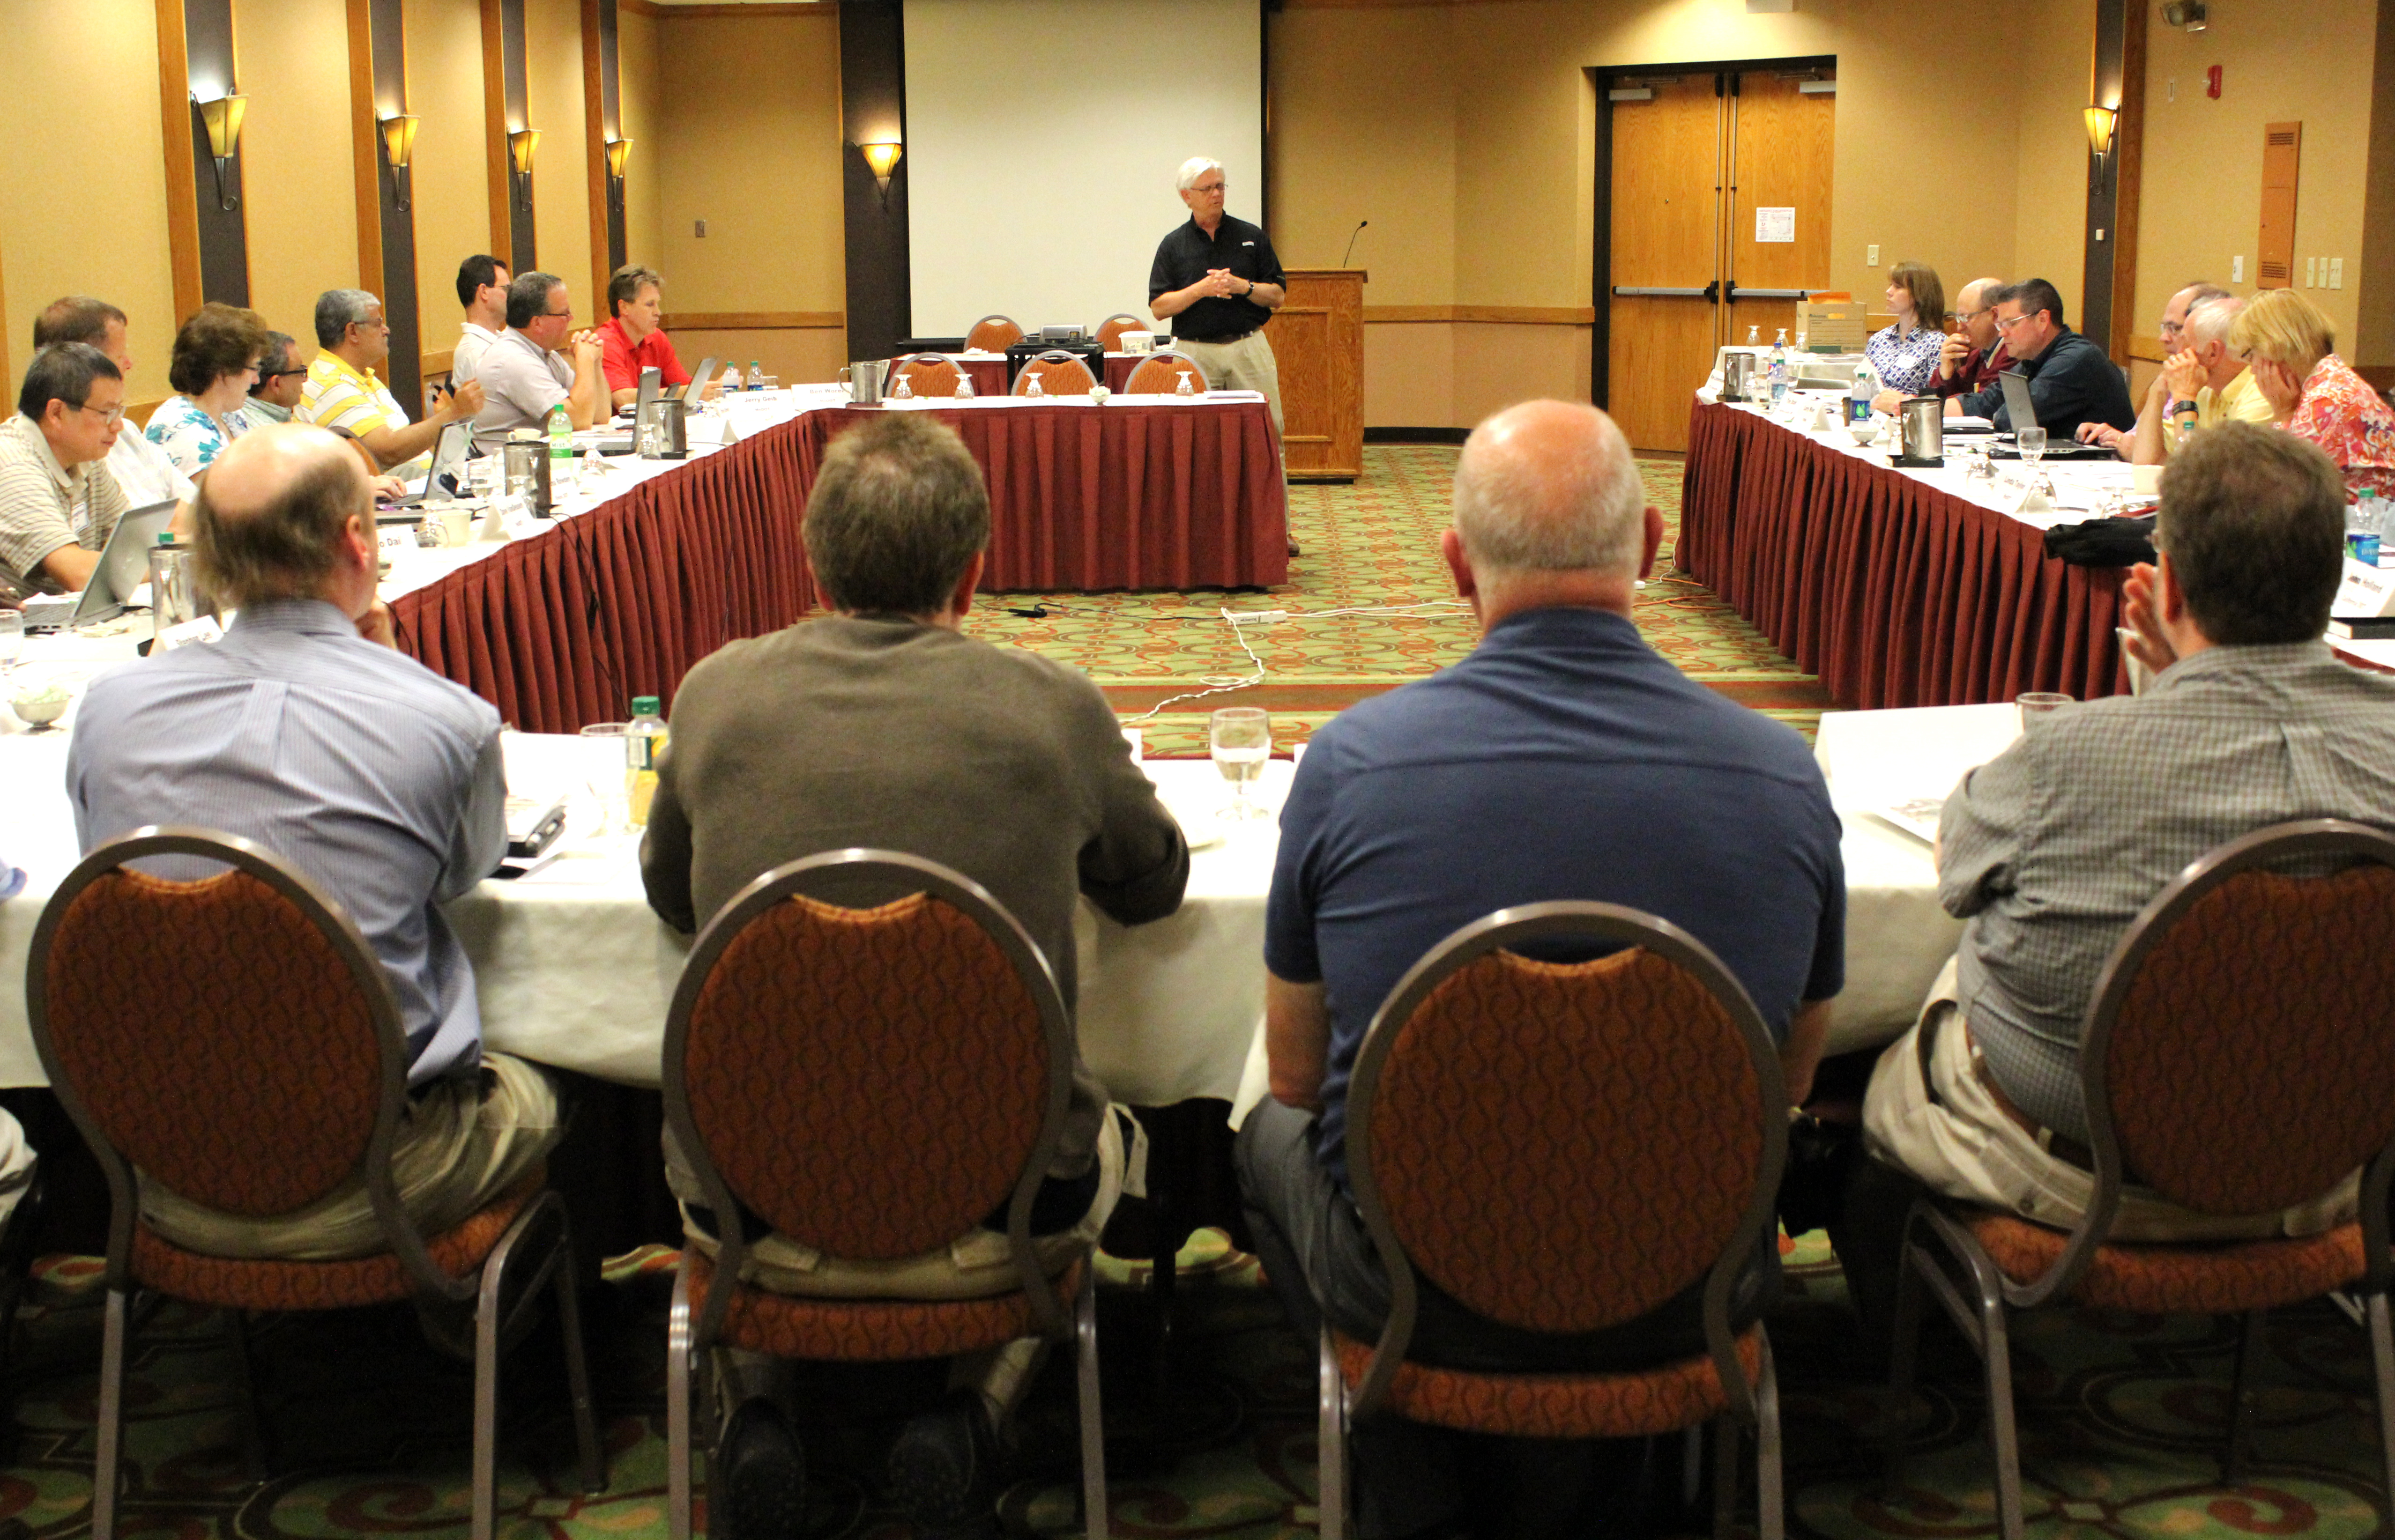
MnROAD is hosting pavement researchers from around North America this week to discuss research conducted at its cold weather pavement testing facility in Albertville, Minnesota.
Participants at the three-day conference (June 10 to 12) are reviewing the findings of recent pooled fund studies, sharing their implementation experience and recommending what projects should be picked for the next round of research.
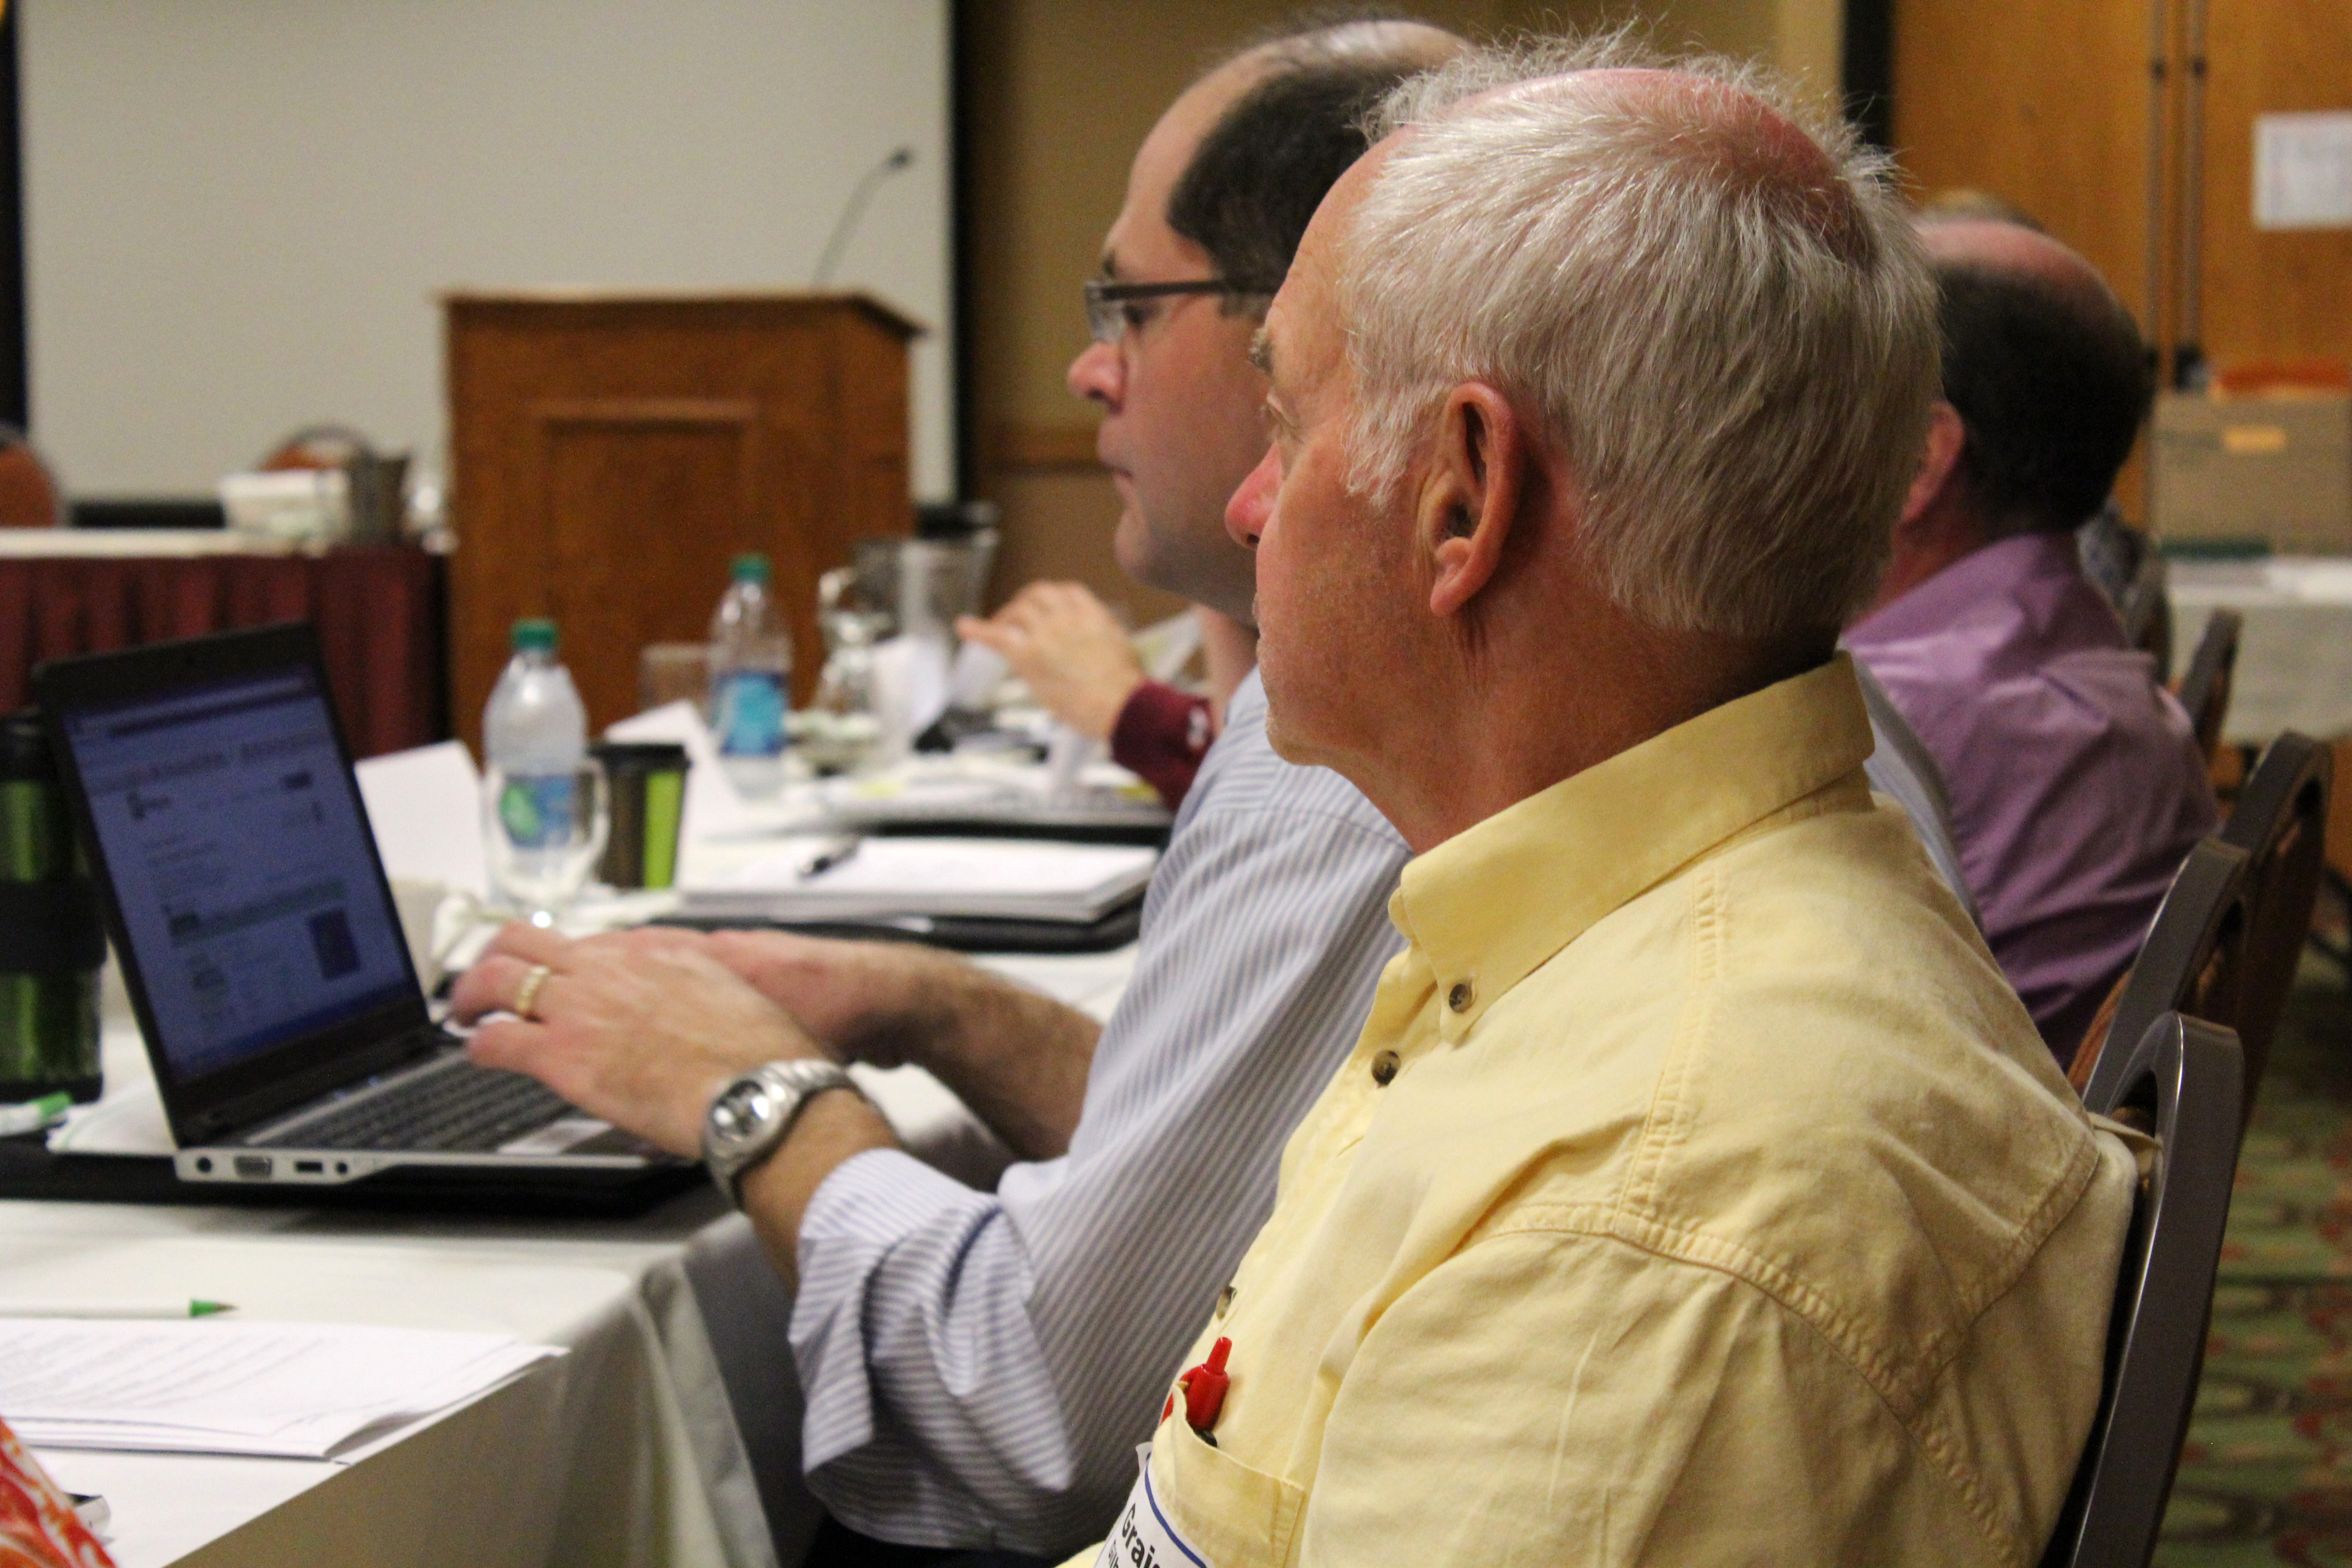
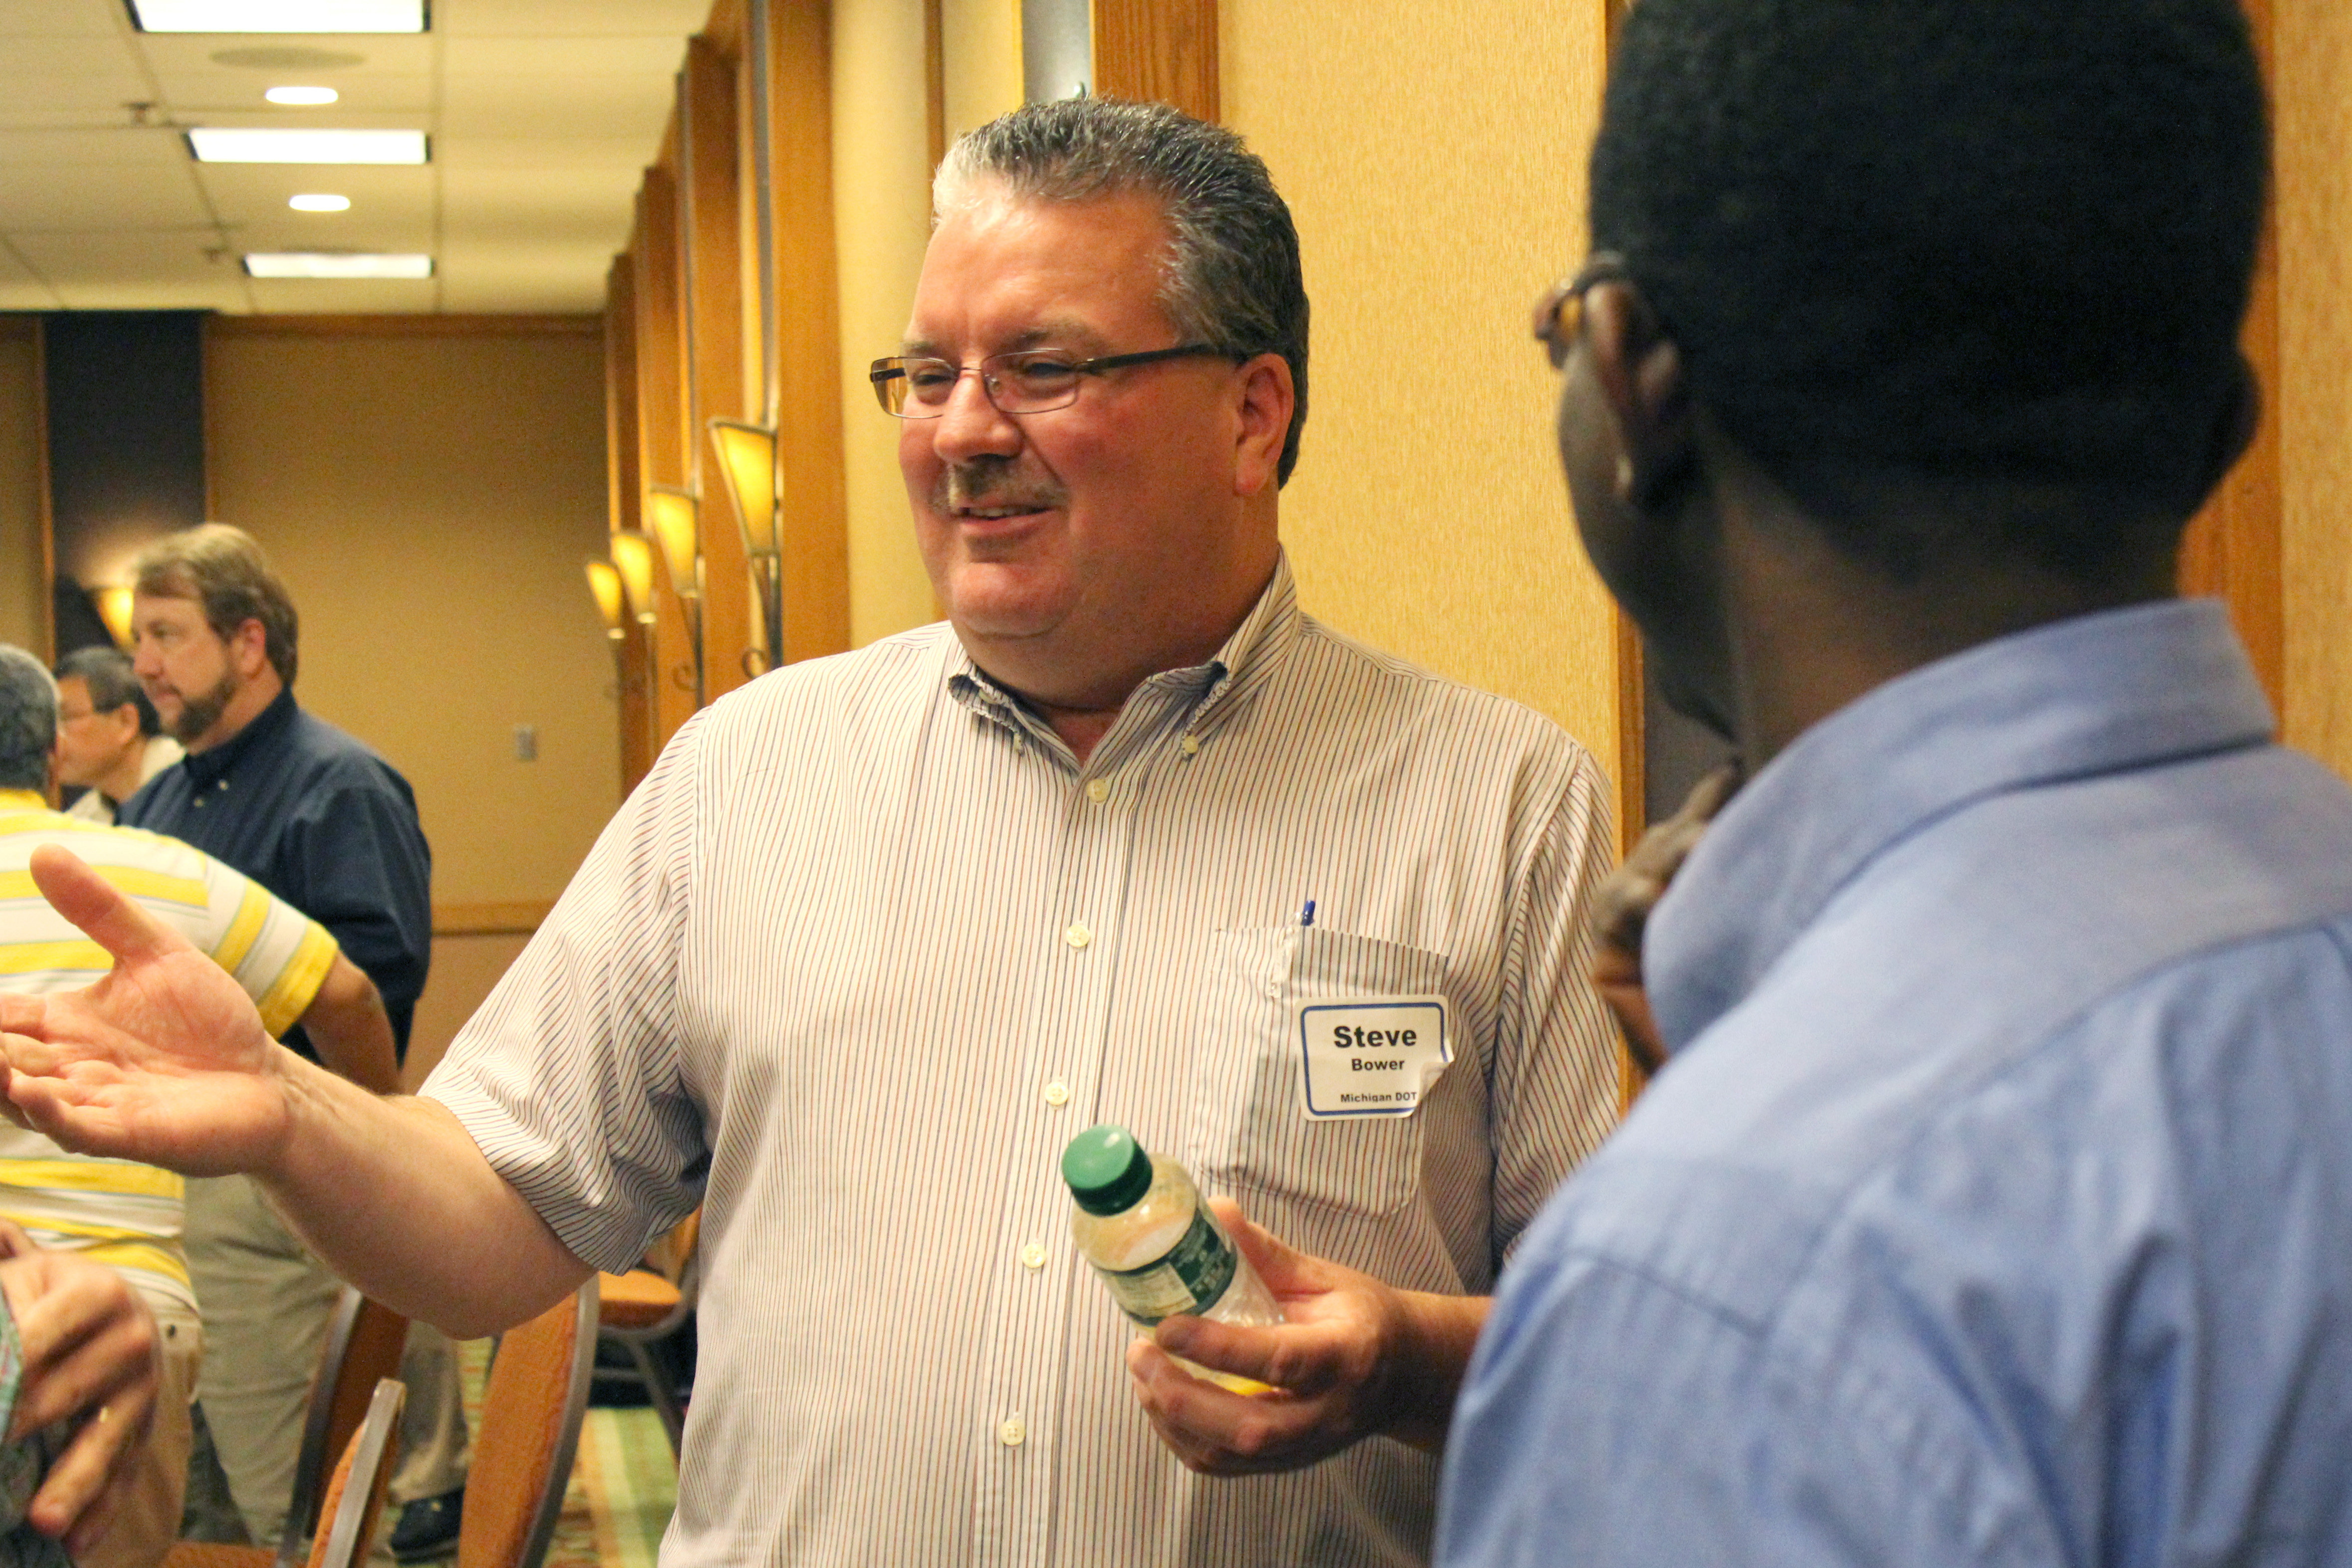
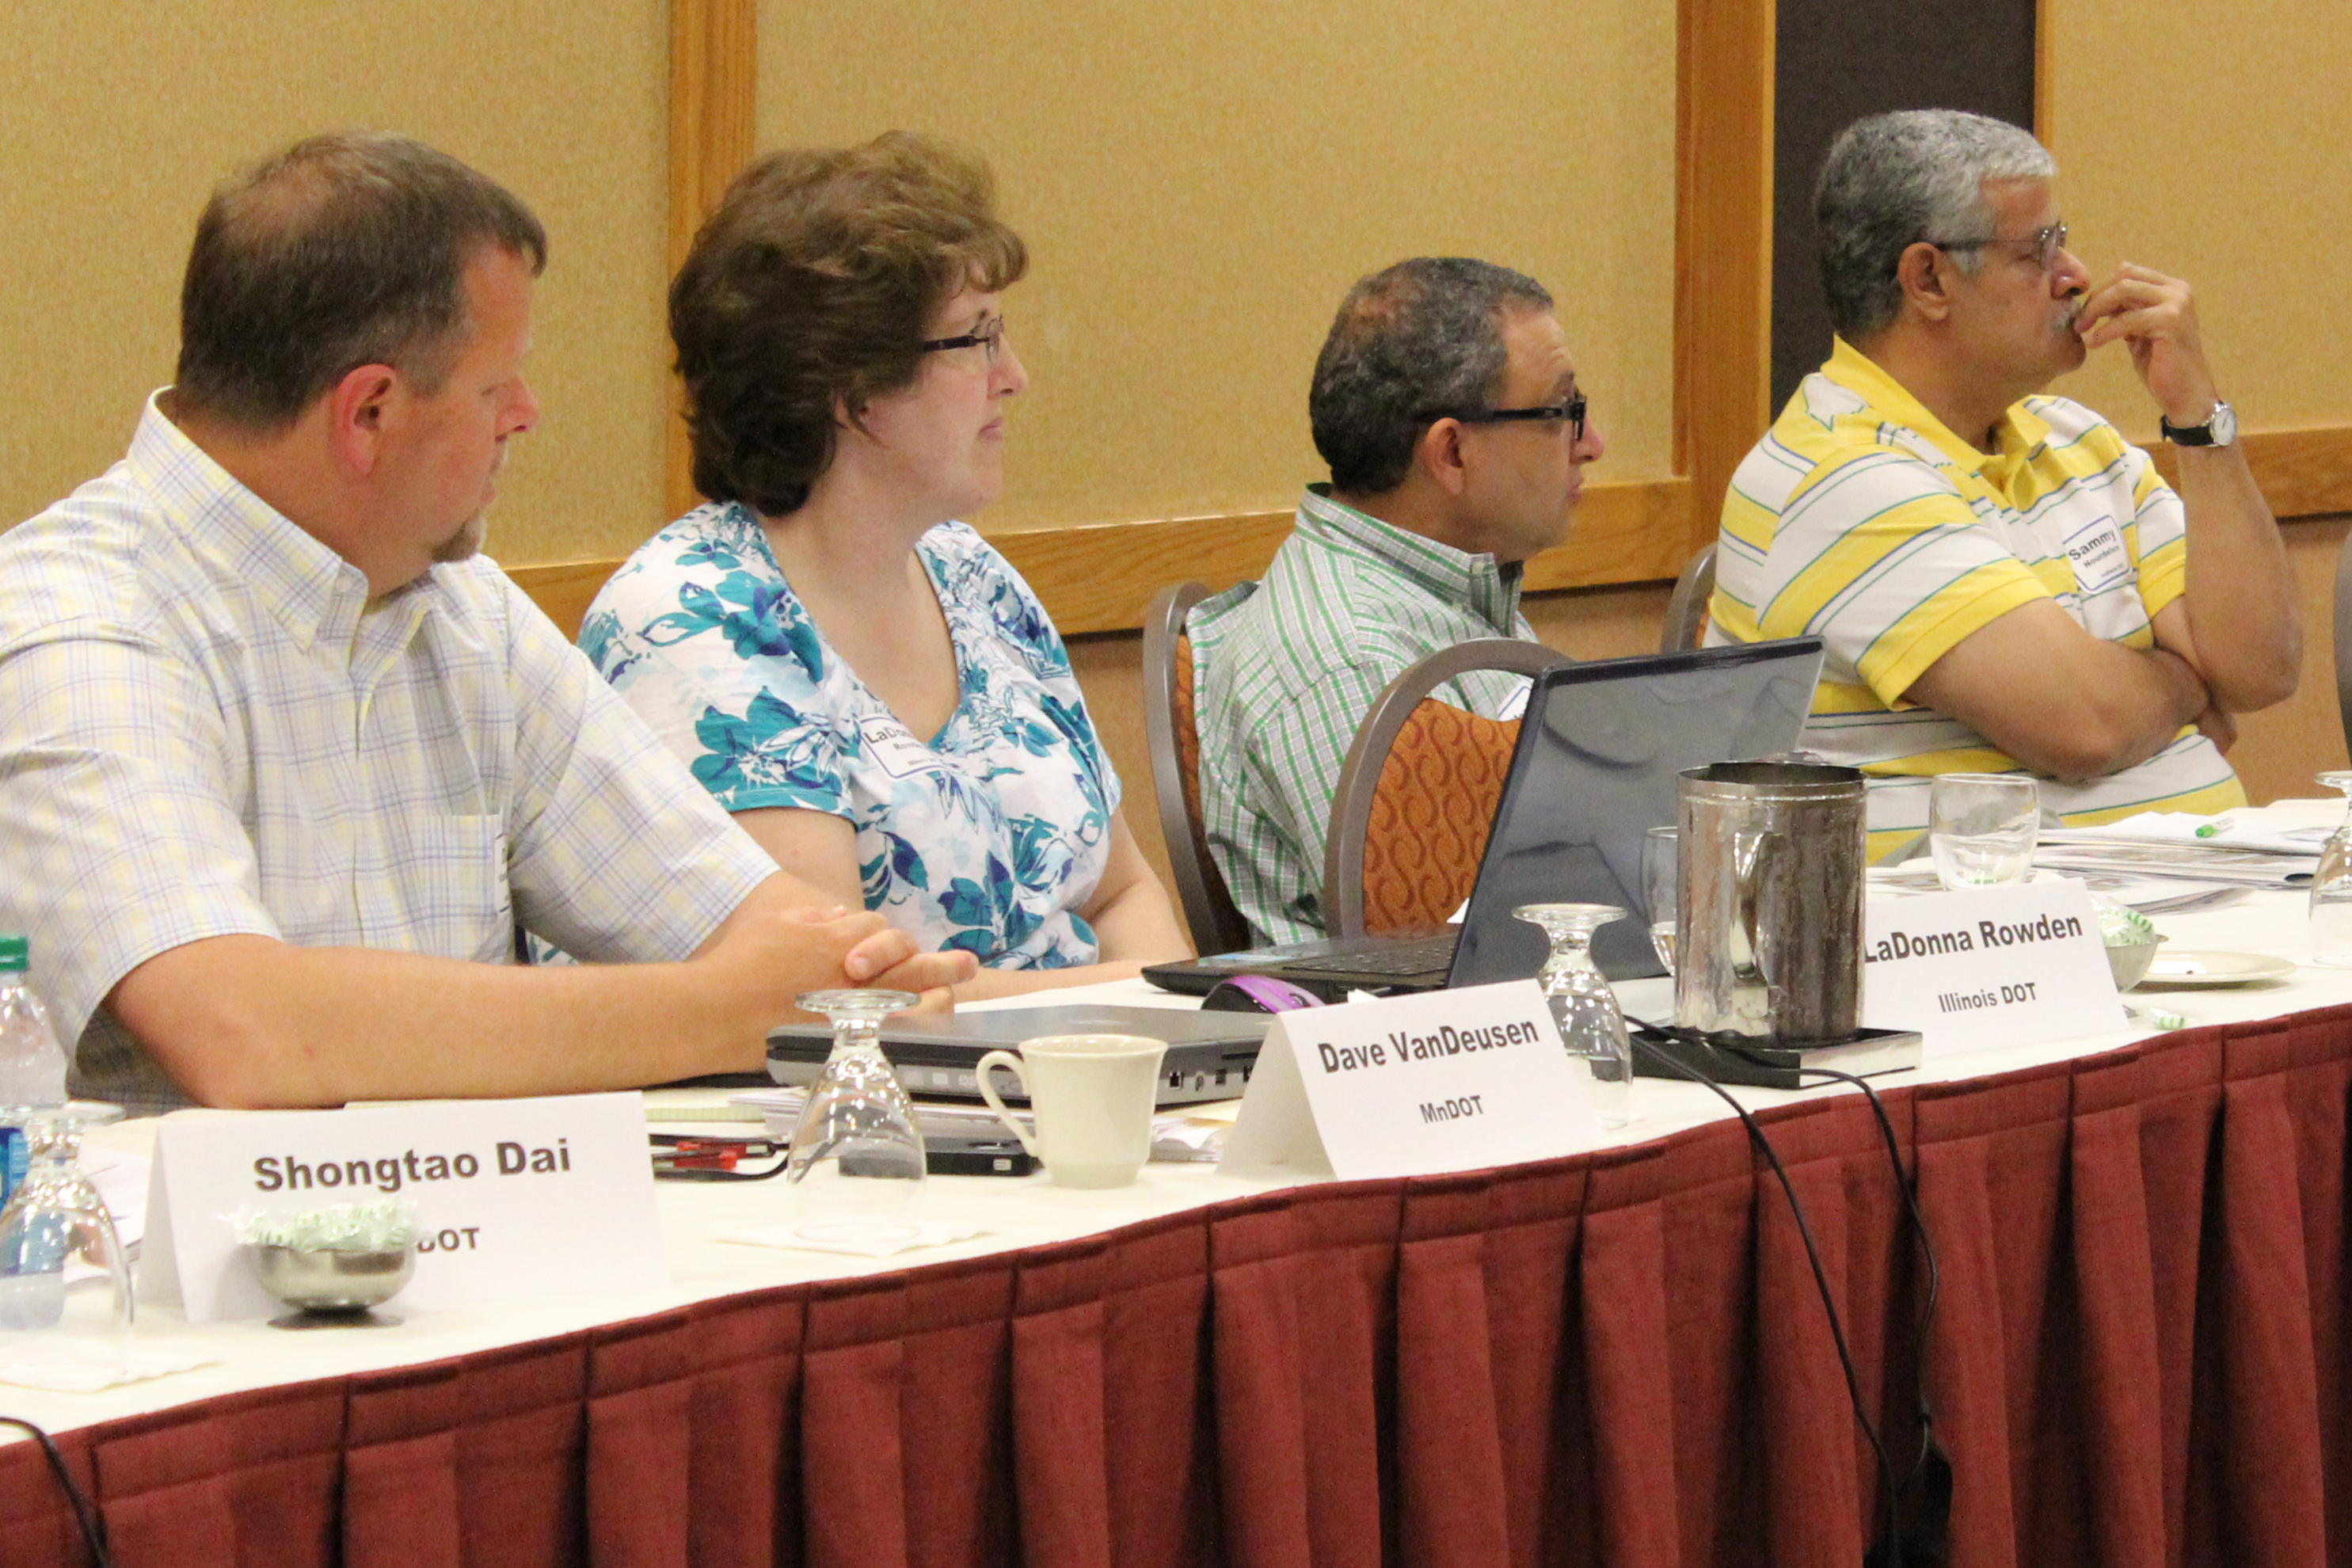
Bob Orthmeyer from the Federal Highway Administration said MnROAD is the only facility in the country that could supply several test sections needed for a recent study.Graig Gilbertson from MnDOT District 8 listens to one of seven presentations Tuesday on how agencies have implemented MnROAD’s second phase of research projects.Stephen Lee shares the Ontario Ministry of Transportation’s experiences during a discussion Tuesday on research implementation.Steve Bower, a Michigan Department of Transportation Research Engineer, visits with MnROAD researcher Bernard Izevbakhai, right, and other peers.Construction engineering professor Joe Mahoney, from the University of Washington, leads a group discussion on improving research efforts at the close of the session Tuesday.From left, Dave VanDeusen from MnDOT, LaDonna Rowden from the Illinois Department of Transportation, Magdi Mikhail from the Texas Department of Transportation and Samy Noureldin from the Indiana Department of Transportation.Researchers came from Missouri, Maine, Texas, Illinois, Michigan, California, Ontario, Wisconsin, Indiana and Washington for the three-day workshop.
We recently blogged about a research project to evaluate a new type of rumble strip that produces significantly less external noise than traditional designs. The above video, shot near Thief River Falls, Minnesota, shows a comparison between traditional rumble strip designs and the newer, “sinusoidal” rumble strips (a.k.a. “mumble strips”).
The life-saving benefits of rumble strips are well-established, but traditional designs produce external noise that residents consider to be a nuisance. The issue has pit safety concerns against quality-of-life concerns in some parts of the state. Researchers are investigating whether sinusoidal rumble strip designs, which are much quieter, are effective enough to combat drowsy or inattentive driving.
The video is not exactly a scientific comparison, but it does give the viewer a good sense of the difference in noise levels produced by the two styles of rumble strips. The results of the actual research project are expected to be available later this year.
Traffic signs provide important information to drivers, and are a critical component of traffic safety. In order to be effective, their visibility and readability must be maintained under both day and night conditions.
Key to signs’ effectiveness is a quality known as retroreflectivity — the ability for signs to bounce light back toward a driver’s eyes, making them appear brighter and easier to read. Retroreflectivity deteriorates with time, so transportation agencies need to actively maintain their signs.
A research project funded by the Local Road Research Board is developing a guide to help cities and counties better manage their signs, and also to meet a new Federal Highway Administration retroreflectivity management requirement while getting the lowest life-cycle costs.
Cities and counties have until June to establish a sign assessment or management method that will maintain minimum levels of sign retroreflectivity.
“Right now there’s a mixture of different management methods, with very little guidance as to what’s appropriate for your agency based on the signs you have and your labor force and equipment,” said Matt Lebens, a MnDOT research project engineer.
Since 1993, the Manual on Uniform Traffic Control Devices has included guidelines for minimum retroreflectivity of pavement markings and signs. The standards are meant to ensure that drivers, especially the growing population of elderly drivers, are able to detect, comprehend and react to traffic signs. The LRRB project is designed to help fill certain knowledge gaps in this area.
Measuring retroreflectivity
Possible methods for ensuring retroflectivity include night-time inspection; use of a reflectometer; spot-checking a sampling of signs that are the same age; or blanket replacement of signs once they reach a certain age.
Although the retroreflectivity of a sign is guaranteed by its manufacturer to last a certain number of years, it commonly lasts much longer.
“Currently, we don’t have expected sign life guidance for agencies to use. Through this project, we are establishing a control deck for sign sheeting used in the state, and an expert panel will make recommendations on expected sign life ranges,” Lebens said.
Researchers reviewed retro-reflectivity studies from other states and also measured the retro-reflectivity of signs out in the field across Minnesota using a retroreflectometer. As part of this project, MnDOT is providing training on the retroreflectometer and will also make it available for loan to local municipalities. (Watch a video demonstration.)
At MnDOT’s MnROAD site, control decks contain dozens of signs. In addition to measuring retroreflectivity, the MnDOT Materials lab is monitoring color fade, which has been a larger issue in Minnesota.
“By getting better data as to the real life in-field life span of the signs, agencies will have a more realistic and better informed value for sign life expectancy, as well as potentially reducing costs,” said MnDOT Senior Engineer Mark Vizecky.
Expected life
There’s been no definitive studies to date as to what the life of a sign is, said lead project investigator Howard Preston of CH2M Hill, but the research so far shows it is in well excess of manufacturer warranties.
Cities and counties will be advised to pick an expected sign life that goes beyond the warranty – and then stay tuned.
“The notion is to watch these signs until they fail,” Preston said. “The sheeting material is better than it used to be. The failure might be 20 or 30 years out.”
There are two basic types of reflective sheeting material: beaded and prismatic.
Although beaded is guaranteed to last 10 years, researchers anticipate a retroreflectivity life of between 12 and 20 years old.
For the prismatic material – which has a 12-year warranty – the life cycle is anticipated to be 20 to 30 years.
“Nobody knows for sure, because nobody has actually followed this material to failure in a controlled condition,” Preston said. “On the road, there are so many variables: vandalism, knock-downs, etc.”
Researchers look at the test deck at MnROAD. The study panel includes city and county engineers.