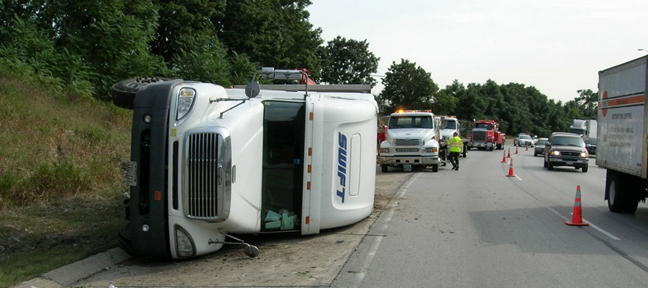
When a semi carrying millions of bees crashed three years ago on Interstate 35, a five-mile stretch of freeway near Lakeville had to be shut down, and it took several hours to re-open.
A new pilot project under way in southern Minnesota would move traffic more quickly during accidents like these by having a predetermined route along I-35 to redirect motorists.
Currently, when the Minnesota State Patrol decides to close a freeway, motorists are left to their own devices to determine where to go.
“The use of emergency alternate routes are very helpful in rural areas where other roadway options might be limited,” said project consultant Andy Mielke of SRF Consulting, who helped the state of Wisconsin establish similar routes along its interstate.
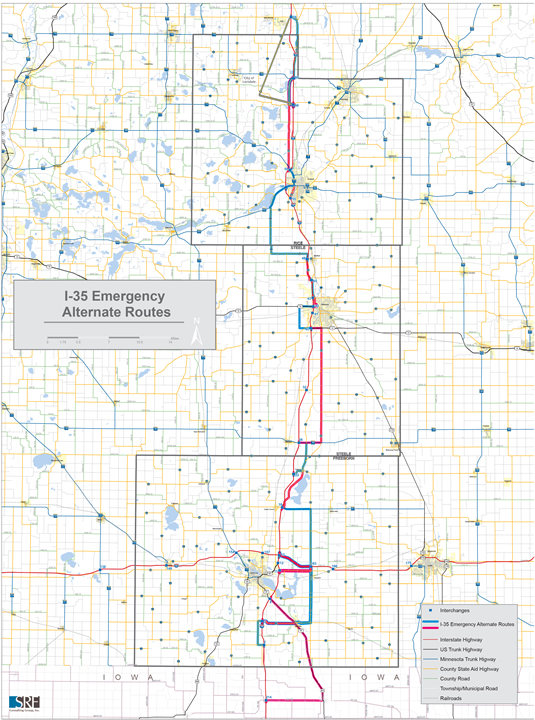
The MnDOT-funded research project establishes a permanent alternate route parallel to the interstate in Freeborn, Steele and Rice Counties.
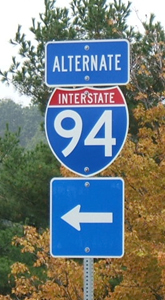
MnDOT worked with local officials to identify the best alternative roads and is in the process of procuring signs to permanently affix along the I-35 alternate route this summer.
Picking a route
Identifying an emergency route wasn’t easy. Engineers had to consider the proximity to the freeway, whether a route was direct enough and whether the roads could handle heavy truck traffic.
A planning committee that included MnDOT, the State Patrol and three county engineers developed a route and procedures for everyone to follow.
“All of the responders know where the traffic is going, so they’re all operating off the same sheet of music,” Mielke said.
The alternate route system is intended to reduce traffic delays, minimize secondary crashes, speed the emergency response and keep truck freight moving during a large accident.
More than 5,000 trucks per day travel Interstate 35.
“If you’re a truck driver sitting in congestion, time is money,” Mielke said.
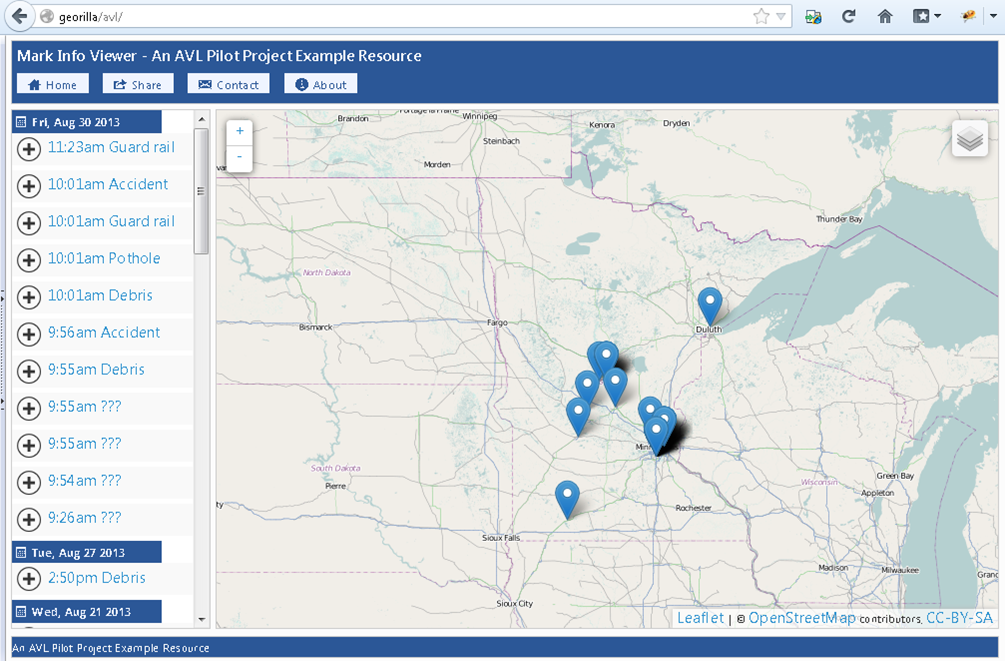
The planning team identified messages that can be automatically deployed on message boards along 35 during an emergency. The route will only be activated if the freeway is fully blocked or once all other methods of moving traffic are exhausted.
The interest for the project came from MnDOT District 6 Traffic Engineer Mike Schweyen, who participated in Wisconsin’s planning for an emergency alternate route in the La Crosse area.
An I-35 Corridor Emergency Alternate Route Operations Guide has been created. The route plans just need final approval now from the county boards.
This project could be an example for the rest of the state to follow. Other MnDOT districts are considering establishing alternate freeway routes in their districts.
Related Resources
Alternate route plans for Freeborn County, Steele County and Rice County (PDFs) (subject to final county board approval).