There’s nothing like colored concrete to make a crosswalk, sidewalk or breezeway look snazzy.
But the extra touch that many cities are putting into their downtown streetscapes may not be so pretty in just a few short years.
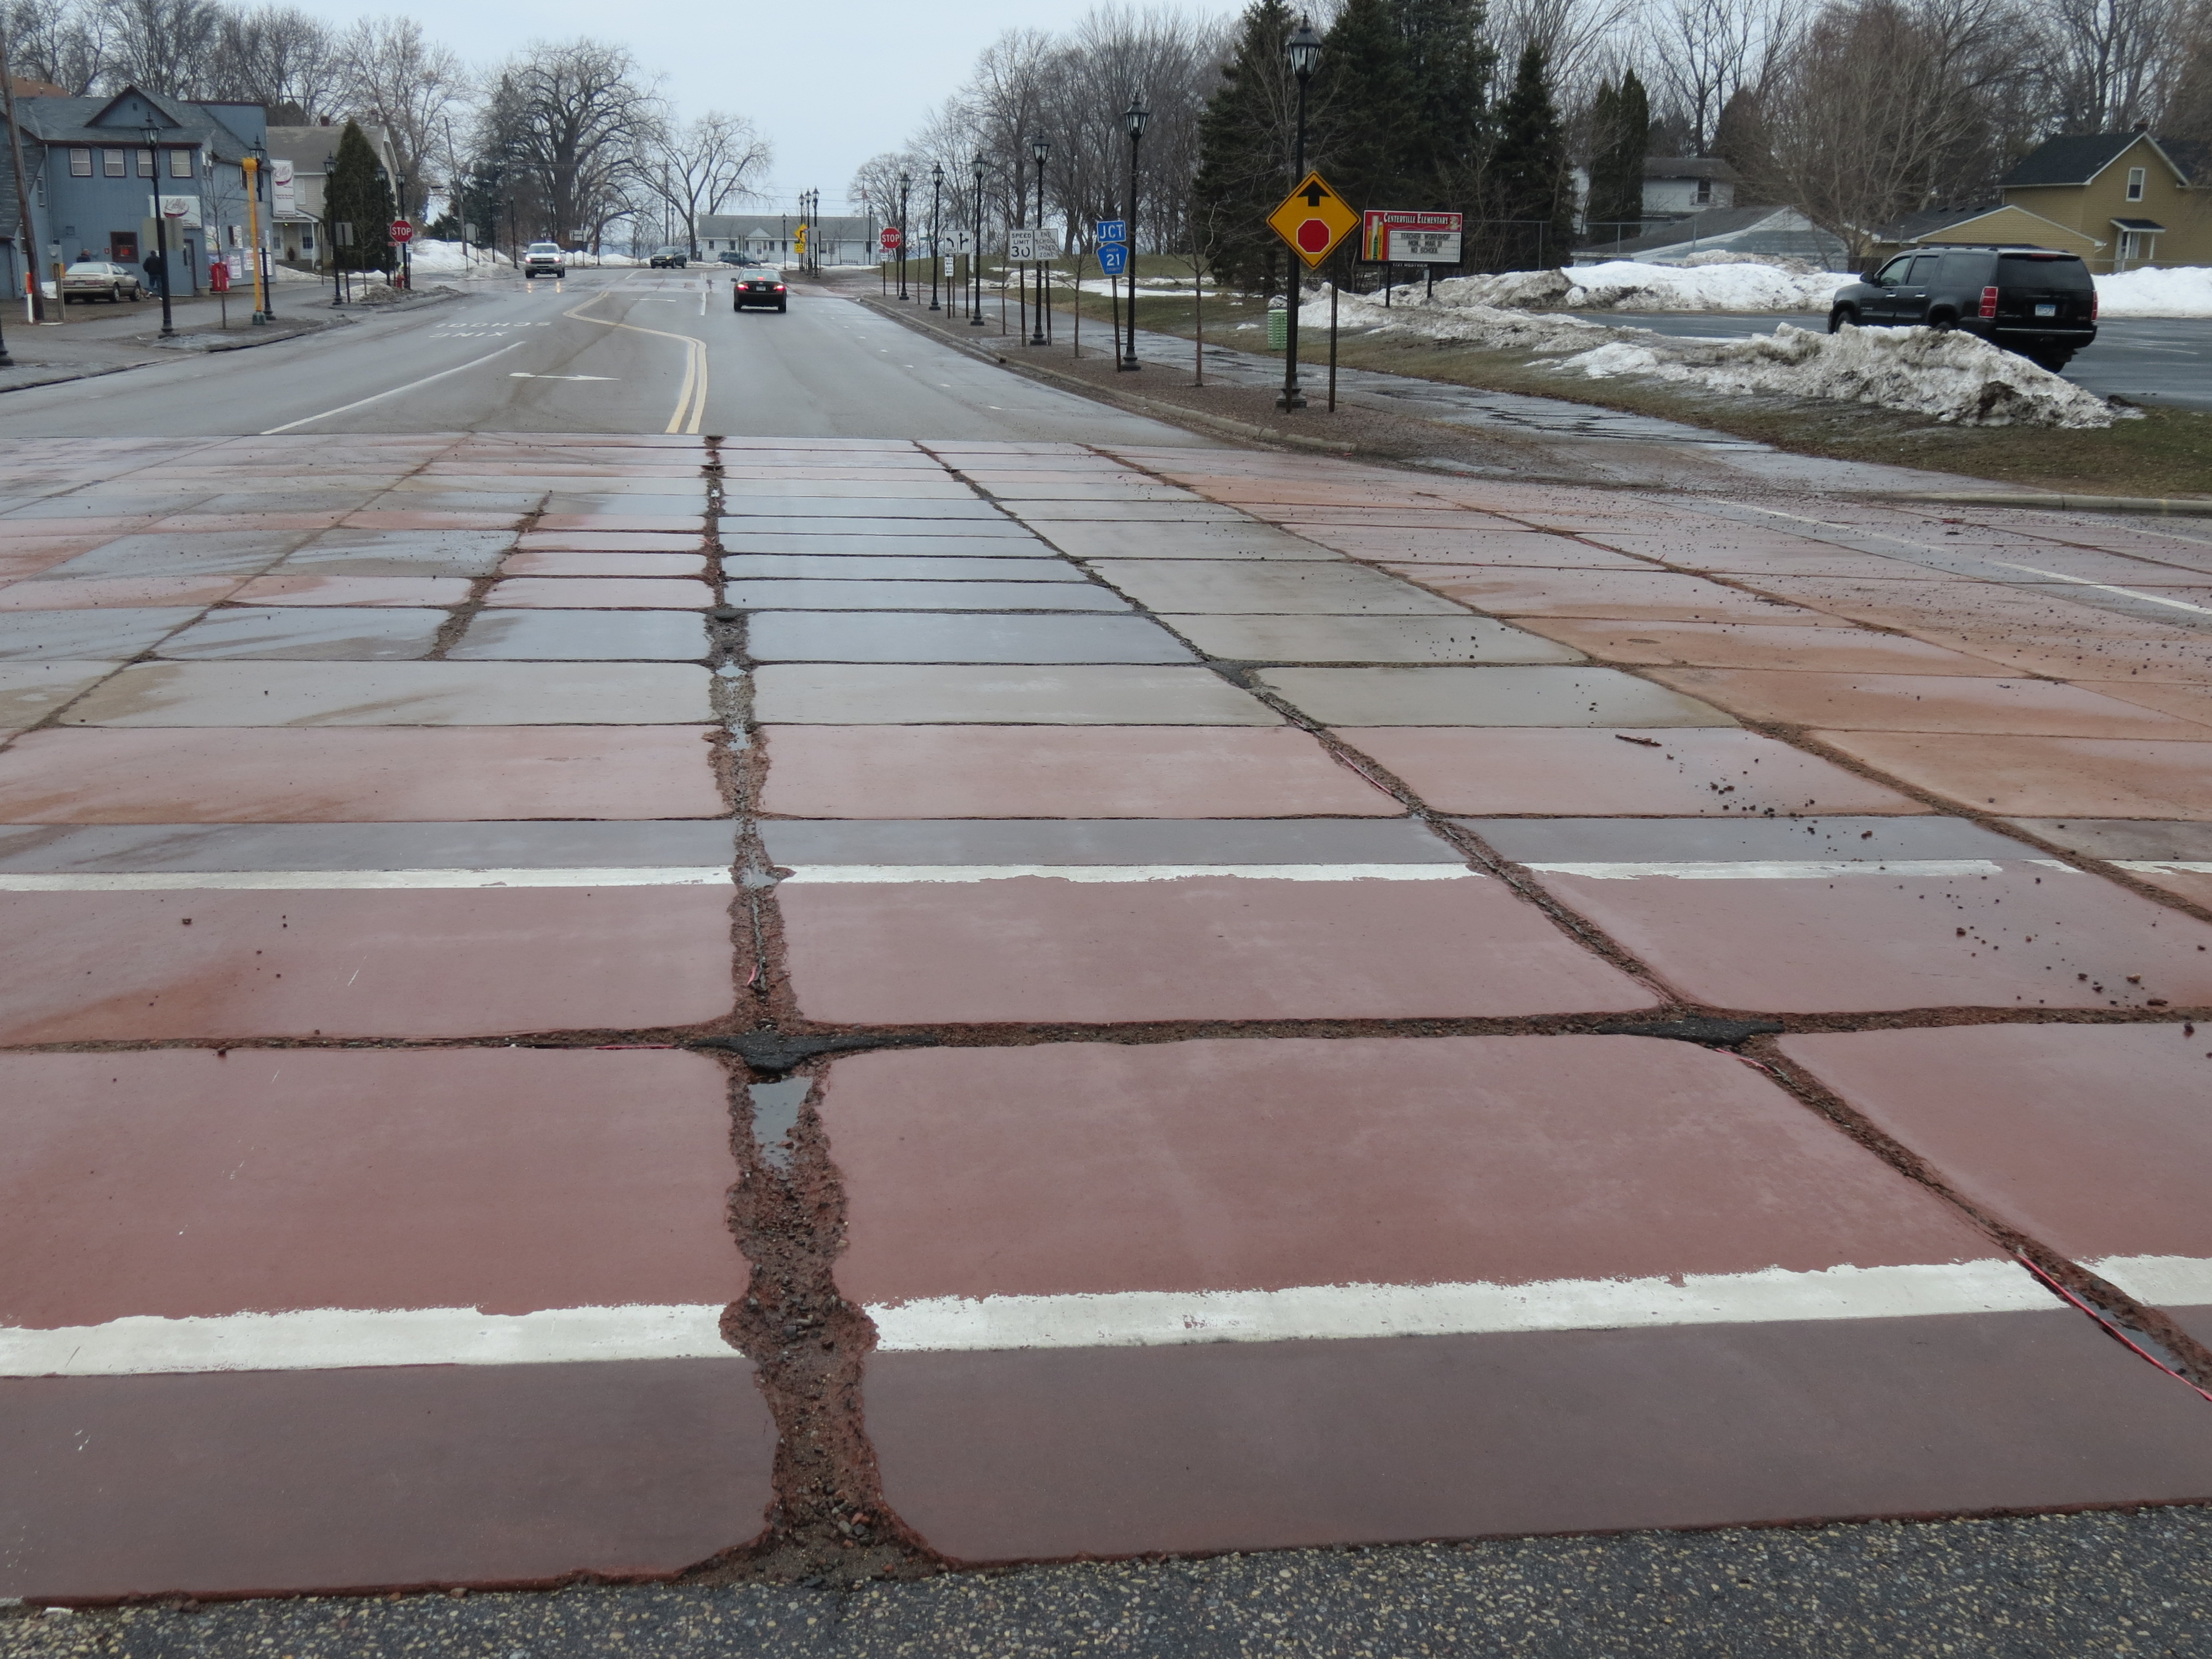
Early cracking has prompted the city of Vadnais Heights to tear up its colored concrete, and the city of Centerville — which installed colored concrete only six years ago — plans to follow suit, said MnDOT’s Senior Road Research Engineer Tom Burnham.
Both cities participated in a recent study, sponsored by the Local Road Research Board and conducted by MnDOT, to determine what is causing the early deterioration.
Across Minnesota, many of the estimated 45 colored concrete projects have experienced early deterioration, particularly microcracking near contraction joints. While this type of distress also occurs with regular concrete, it appears to be accelerated in the colored concrete projects, within five years in some instances.
Although the newly released study identifies likely causes for the failing colored concrete, further research is needed to evaluate proposed solutions.
Findings
Researchers determined that the colored concrete mixtures have likely been too porous for Minnesota winters, allowing deicing chemicals to leach in and wreak havoc. Although not quite as problematic for sidewalks and medians — which aren’t salted as heavily — it is especially bad for colored crosswalks.
A denser concrete mixture (one formed with less water) is recommended; however, constructing the concrete panels this way will require extra steps.
“There are chemicals that can be added to the mixture to artificially lower that water-to-concrete ratio,” Burnham said. “This will allow a denser mixture to be more easily placed.”
Color in vogue
Although there was a spate of colored concrete construction in Ramsey County in the late 1990s, it has only come into fashion in the rest of the state within the last five to six years, according to Burnham.
“You go to almost any community and they’re installing it — on their sidewalk and medians and also crosswalks,” said Burnham, who coordinated the research study.
Because of the added expense, cities may be very disappointed in the results.
The city of Stillwater, which installed a colored concrete panel crosswalk on its main street just two years ago (see top photo), is already experiencing cracking and deterioration in several panels.
Possible remedies
Although reducing the porosity of the colored concrete mixture should help, it won’t solve everything.
Another issue is the curing. The typical white curing product can’t be applied like it is with standard concrete, so curing the colored panels is more challenging, Burnham explained.
There are possible remedies, however, to assist with the curing, such as wet burlap or curing blankets.
Adding complexity to the issue are the new deicing chemicals on the market, which are also impacting regular road materials.
Several test samples showed evidence of chemical attack of the cement paste and fine aggregates, as well as an alkali-silica reaction, which can cause cracking or spalling and isn’t normally seen in regular concrete.
“Is there anything unique with the coloring that would accelerate the observed chemical reactions? We didn’t feel we had enough samples and knowledge at this point to conclusively say,” Burnham said.
Different construction techniques could go a long way toward increasing the livelihood of colored concrete; however, it could take several years of observation to determine if other methods work.
MnROAD is considering adding colored concrete panels to its facility for testing.
Until more questions are answered, MnDOT researchers are recommending repair techniques and alternative streetscaping ideas to cities, such concrete stains, pavers or colored high friction surface treatments.
In addition to sharing the findings with cities and counties, Burnham wants to educate contractors.
“We hope this research is a wake-up call for the colored concrete industry too because we don’t want the industry to die in Minnesota,” he said. “If it can work, we want cities and counties to be able to use it.”
*Editor’s Note: This story was updated 09/04/2014 to specify that this research project was funded entirely by the Local Road Research Board, and that MnDOT conducted the research.
Related Resources
- Investigation and Assessment of Colored Concrete Pavement — Final Report (PDF, 20 MB, 368 pages); Technical Summary (forthcoming)