For most road crews, repairing potholes is an essential and highly visible duty. Choosing the best or most cost-effective pothole repair method, however, has remained a complicated puzzle.
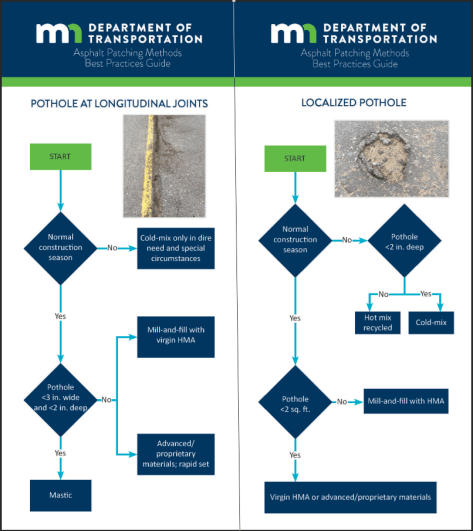
Researchers identified four pothole repair methods suitable for Minnesota: cold mix, hot recycled asphalt, mastic material and mill-and-fill with hot-mix asphalt. They tracked the performance of each method at five sites in northern Minnesota for two years. Using the results from this monitoring period, researchers developed decision trees for selecting an appropriate repair method and best practices for using each method. The decision trees were developed in two formats: as a flowchart that can be used in a maintenance guide and as flash cards that can be laminated and used by maintenance crews for quick reference in the field.
“We wanted to develop a decision tree for choosing the right pothole repair method that could be laminated for use in the field,” said Susan Lodahl, Assistant State Maintenance Engineer, MnDOT Office of Maintenance.
“This project offers help deciding what kind of pothole patch is appropriate for the conditions, including the pothole dimensions, location in the roadway and the season,” said Manik Barman, Assistant Professor, University of Minnesota Duluth Department of Civil Engineering.
What Was the Need?
Repairing potholes is one of the most public of road crews’ duties. Drivers notice cracks and holes, and feel the effects of short-term repairs that kick up gravel as wheels roll over patched holes.
Selecting the appropriate patching method and materials varies depending on several factors, including the size of the pothole and its location on the roadway. Patching methods and materials face seasonal challenges too. In northern Minnesota, asphalt plants shut down for the winter and don’t reopen before March, if then. Potholes that are repaired in cold weather aim for short-term fixes with patches that can be replaced when warm weather returns or when the pavement can be milled and overlaid with hot-mix asphalt (HMA). Road crews have tried applying HMA in winter using various heating systems and in-place recycling methods, but even warm weather patches only offer semipermanent repair.
Whether it’s spring, summer, fall or winter, choosing the best, most cost-effective or durable pothole repair method has remained a complicated puzzle, one that MnDOT would like to help road crews solve.
What Was Our Goal?
MnDOT funded this research to help road crews choose patching methods that match specific repair conditions. Researchers explored patching tools, materials and methods to identify those most appropriate to specific pothole conditions, road locations and time of year. They also evaluated the effectiveness of different methods based on durability, road safety, ride quality, driver satisfaction and other factors.

What Did We Do?
Research began with a comprehensive literature search of pothole repair methods in Minnesota and other states. From this search, investigators identified four repair methods that best suit Minnesota: cold mix, hot recycled asphalt, mastic material and mill-and-fill with HMA.
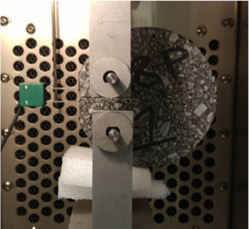
With help from the study’s Technical Advisory Panel, researchers identified five sites in MnDOT District 1 near Duluth, Minnesota, where they oversaw 20 pothole repairs. Investigators monitored these repairs for about two years before assessing the methods and their best applications. Researchers then developed decision trees to help road crews choose the most suitable method for each repair and compiled best practices to provide further guidance.
What Did We Learn?
The best practices describe the best uses of each of the four pothole repair methods along with guidelines for preparing the pothole for repair and placing the patching materials.
Cold-mix patches should be placed only in shallow potholes with depths of 2 inches or less. Deeper potholes should be repaired in two lifts, each compacted with a handheld compactor to prevent dishing or denting when the cold mix settles.
Hot mixes using recycled materials should be avoided. The aged binder slows the heating process, and its fines inhibit the bonding of the new binder and aggregate. The new binder also doesn’t seem to rejuvenate the old, and the patches age more rapidly. When hot mix is used for pothole repair, a handheld compactor is required. Recycling mixers such as the Stepp SRM 10-120 should be used to create virgin hot patch material using asphalt oil and sand or small aggregate.
Mastic material provides a smooth driving surface but appears to dish in potholes along longitudinal cracks because the material lacks the strength to support loads. Mastic should only be used on centerline joints and longitudinal joints along shoulders, where it stays in place. It should not be used in wheel paths.
Mill-and-fill with virgin HMA, when constructed with care, can be effective in eliminating dishing and raveling at the patch-pavement interface. Sufficient tack material must be used, and trucks should not be allowed to drive on the tack. The pothole should be filled with the proper amount of HMA, and the patch must be compacted sufficiently. Failure to carefully apply mill-and-fill can lead to significant deterioration at the patch-pavement interface after about 100 days, which can contribute to additional damage in the distressed area.
Using the findings from this study, researchers developed guidelines for patching method selection, placement, compaction practices and moisture control. They also developed decision trees for selecting the appropriate repair method for conditions. The decision trees are available in two formats: as a flowchart for use in maintenance guides and as flash cards for quick reference by maintenance crews in the field. The final report includes best practices and a step-by-step pictorial guide to patching.
What’s Next?
The decision trees and best practices developed in this study can be easily combined into a patching guide that, with laminated flash cards, can be distributed to MnDOT road crews around the state. This research could be amplified by repeating the process with more pothole repairs in other areas of Minnesota to increase data for performance evaluation and analysis of best practices.
This post pertains to Report 2017-25, “Comprehensive Field Evaluation of Asphalt Patching Methods and Development of Simple Decision Trees and a Best Practices Manual,” published June 2017.