The nation’s two largest pavement test tracks are planning their first-ever co-experiments.
The Minnesota Department of Transportation’s Road Research Facility (MnROAD) and the National Center for Asphalt Technology (NCAT) began discussing a formal partnership last year and have now asked states to join a pair of three-year research projects that will begin this summer.
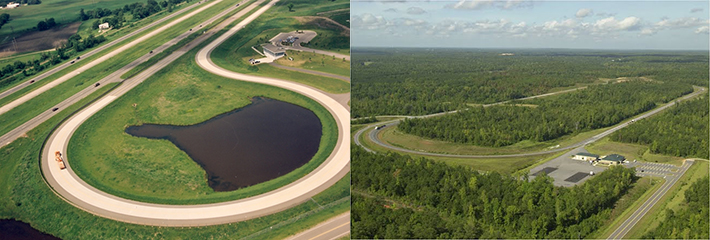
Representatives of the test tracks are meeting next week in Minneapolis at the 19th Annual TERRA Pavement Conference. They said the partnership will develop a national hot mix asphalt cracking performance test and expand the scope of existing pavement preservation research at the NCAT facility in Auburn, Alabama, to include northern test sections in Minnesota.
MnROAD plans to build test sections at its facility and also off-site on a low- and high-volume road, which may include concrete test sections if funding allows. These Minnesota test sections will supplement 25 test sections built by NCAT on an existing low-volume haul route in 2010 and an off-site high-volume test road planned for this summer in Alabama to assess the life-extending benefits of different pavement preservation methods. Both agencies have also been developing performance tests to predict the cracking potential of asphalt mixes, and they will now work together on that research as well.
“We will collect and analyze the data in similar ways, and I think we’ll have a greater appeal nationally, as we cover a range of climate conditions,” said MnROAD Operations Engineer Ben Worel.
Participation in the pavement preservation study is $120,000 per year for the initial research cycle, which will drop to $40,000 after three years; the cracking study will run three years at $210,000 per year. Alabama will be the lead state for this effort.
State departments of transportation are asked for commitment letters this month if they are interested in joining either study, even if they do not have SP&R (State Planning and Research) dollars available at the time. Participating agencies will get to design the scope of the research and be kept advised of the ongoing findings, so they can benefit early from the project. Initial planning meetings will be done through a series of webinars in March and April of this year with participating agencies.
At a January 8 webinar, speakers said the research will help states determine how long pavement preservation treatments will last.
“Many DOTs have really well-designed and well-thought-out decision trees, where they can take pavement management data and end up with a rational selection of pavement alternatives. But the issue of extending pavement life is the really big unknown, because references provide a broad range of expected performance,” NCAT Test Track Manager Buzz Powell said.
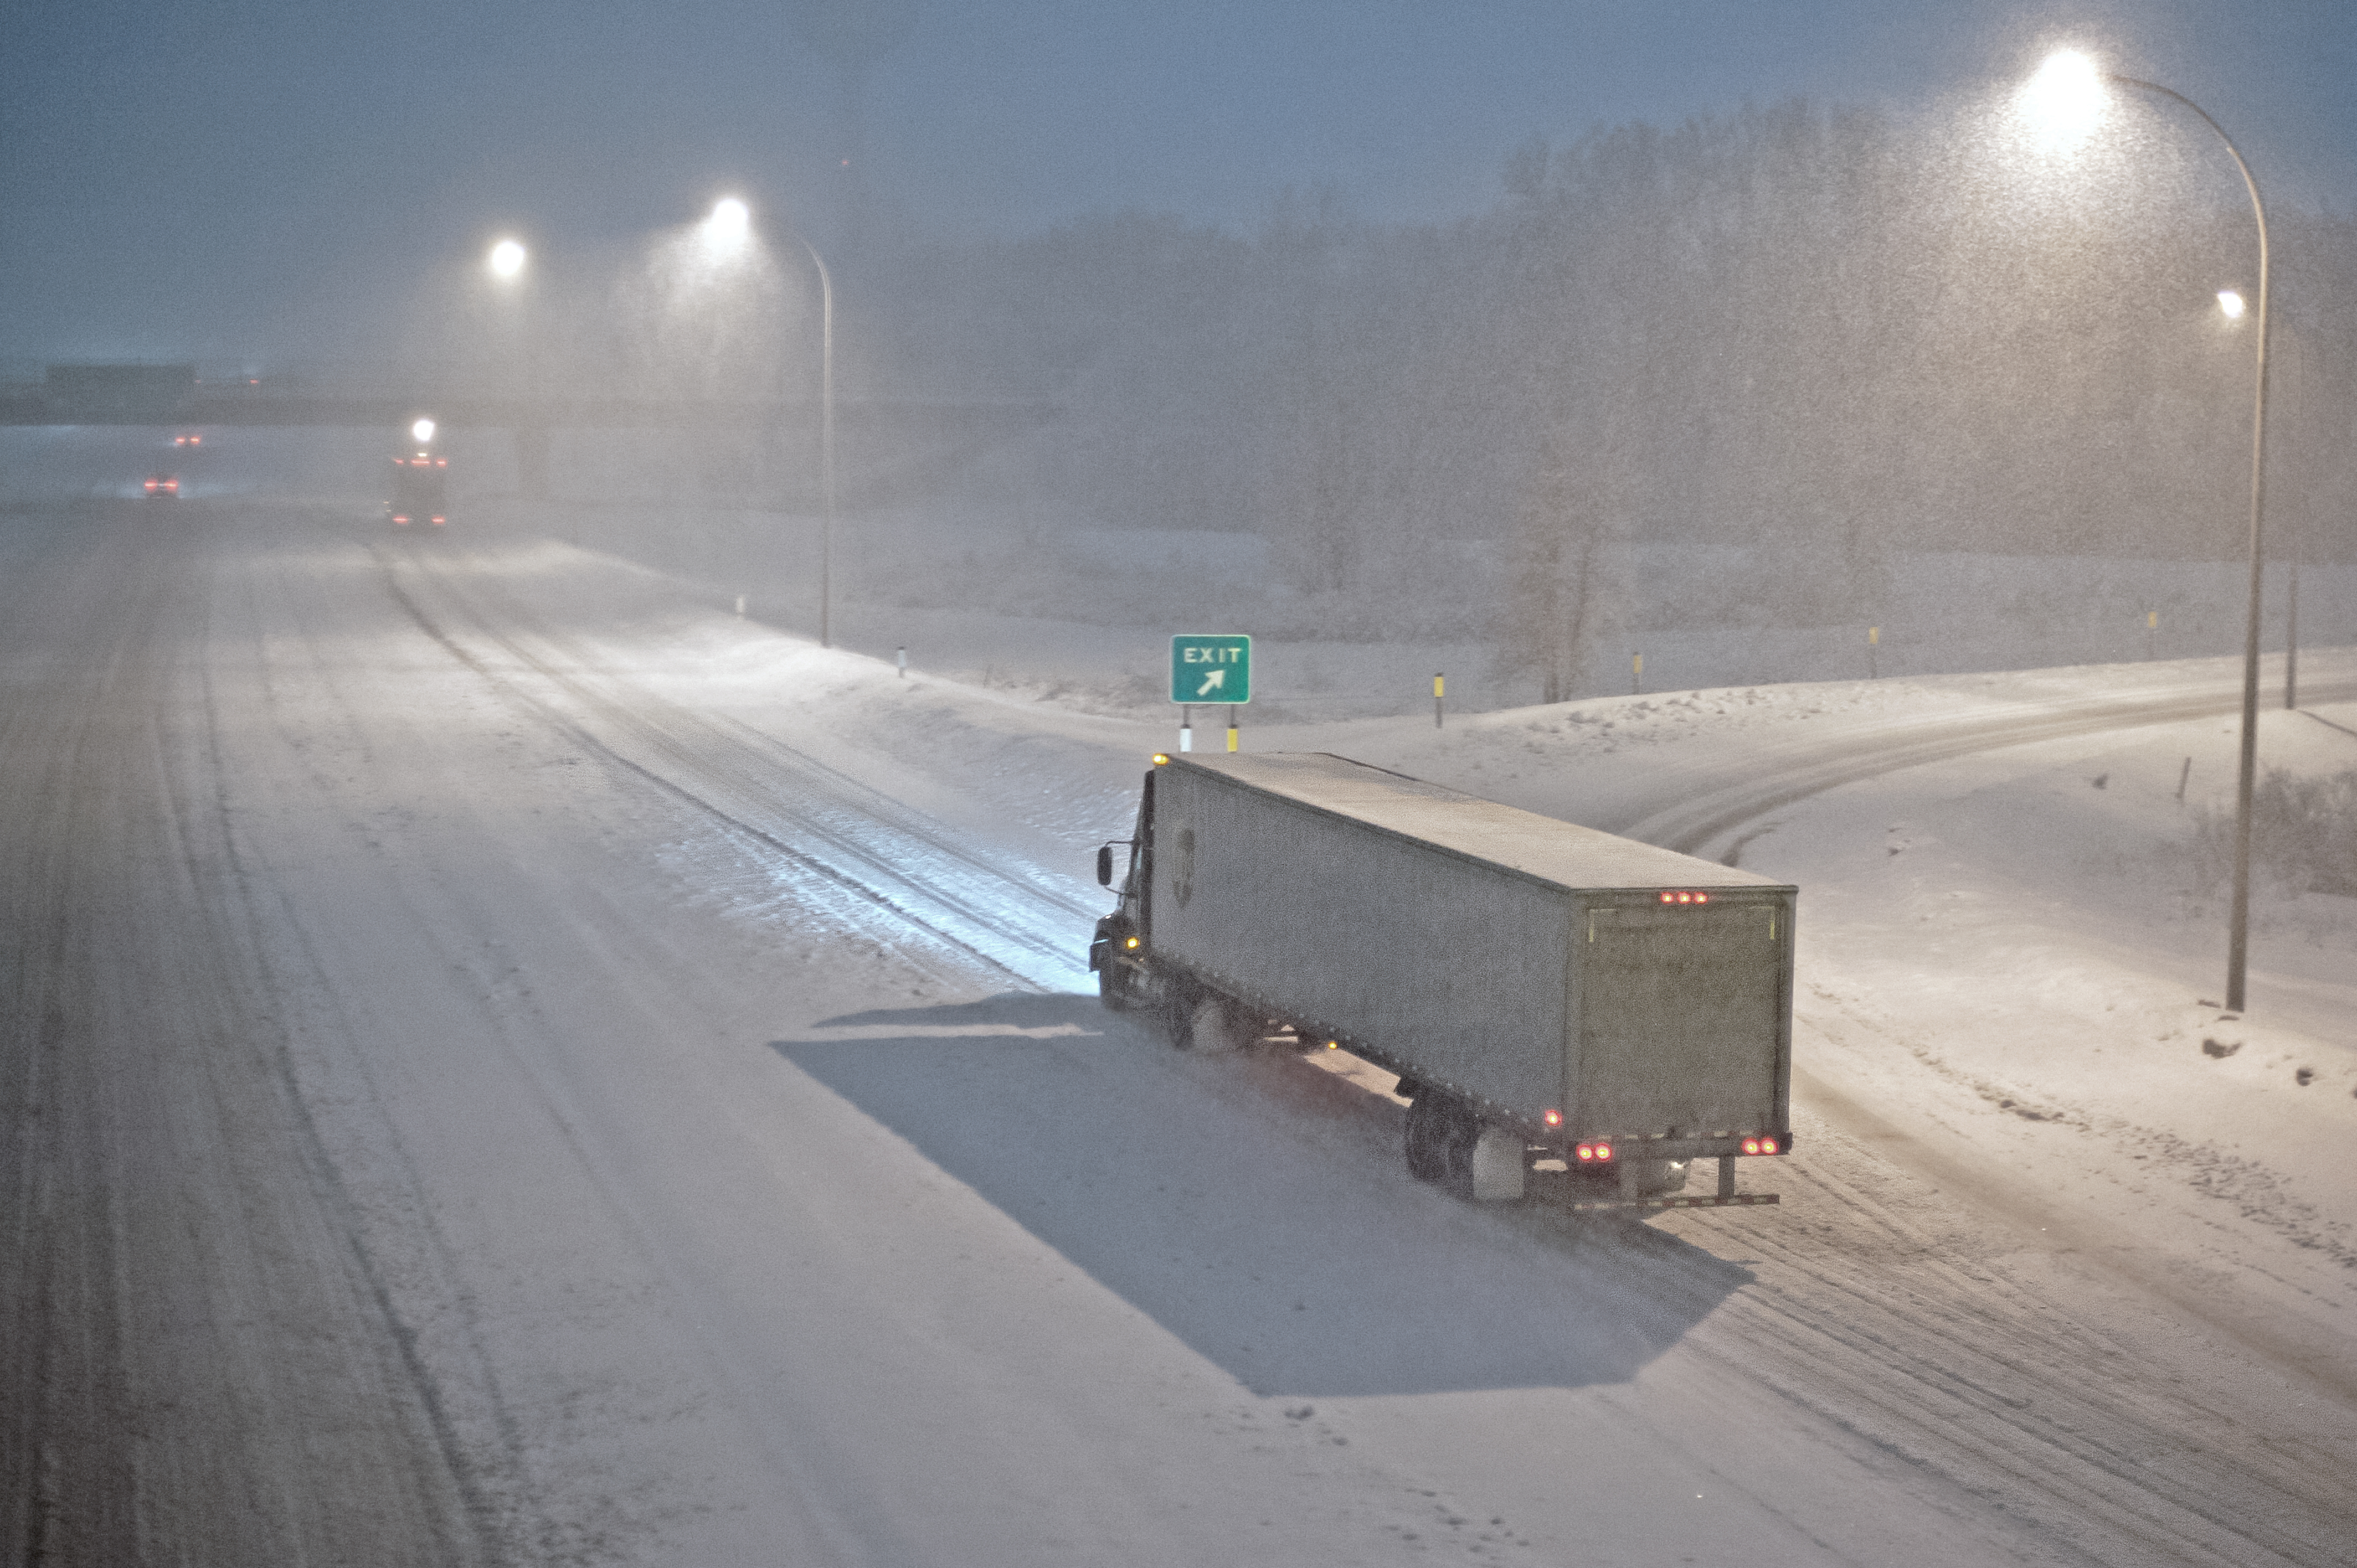
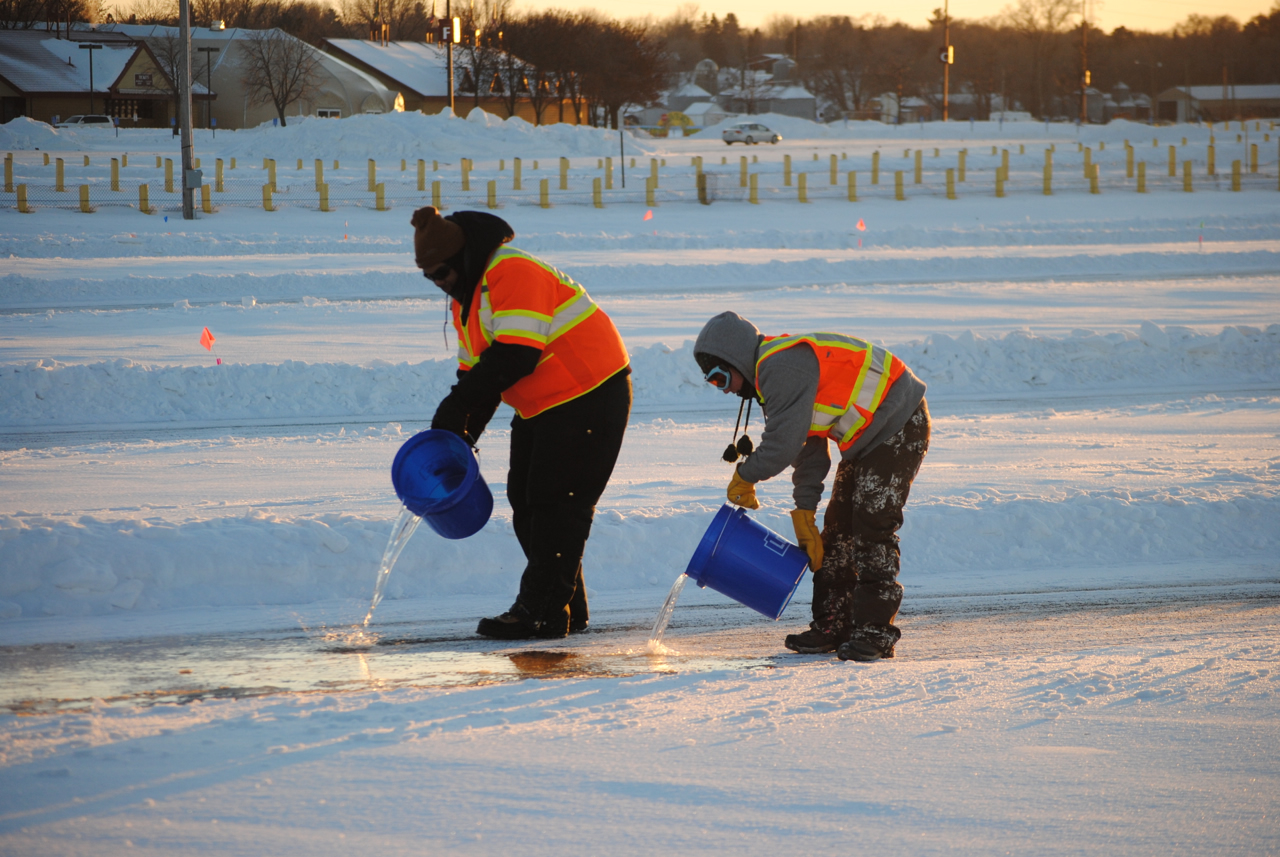
Another benefit is that states can learn how pavement treatments hold up in both hot and cold climates.
“It’s 14 degrees right now in Mississippi. It rains about every three days, freezes and then thaws,” said Mississippi Chief Engineer Mark McConnell. “So we need to know how pavement preservation is going to work in the north as well.”
For additional information, contact Ben Worel (ben.worel@state.mn.us) at MnROAD or Buzz Powell (buzz@auburn.edu) at NCAT.