Tag Archives: MnDOT

What those signs over the freeway are actually telling you

Two years ago, MnDOT installed a series of electronic speed limit advisory signs over Interstate 94 between Minneapolis and St. Paul. The Variable Speed Limit (VSL) system is designed to reduce congestion and help prevent crashes by recommending lower speed limits to motorists during periods of high traffic.

The new technology has worked in other places, including China and Germany. In Minnesota, a similar VSL system on I-35W reportedly had moderate benefits in reducing the total amount of congestion during the morning commute south of Minneapolis.

Although the verdict on I-94 congestion is still pending,  a newly released study has found that the new system has not made a measurable impact so far on crashes in an accident-prone stretch of freeway in downtown Minneapolis. Why not?

University of Minnesota researcher John Hourdos has a few theories.

One is a simple time  lag in the congestion reporting system. Another is a requirement that all lanes display the same speed limit, which he said causes confusion when only one lane is actually congested. The complexity of the I-94 commons also appears to be beyond what the VSL system was designed to do. And according to Hourdos, one of the most significant problems is the driving public simply doesn’t understand what the signs are telling them.

“People do not know what the system really does,” Hourdos said. “There hasn’t been much education on it other than a couple of news articles over the years. And when they try to decipher it on their own they get even more confused.”

The I-94 Commons area has a major bottleneck where the I-35W northbound ramp merges with I-94 westbound (between Cedar Avenue and 11th Avenue). Vertical red lines indicate locations of gantries that display variable speed limit advisories.

The advisory speed limits are posted in response to varying traffic conditions. As vehicles approach the commons area, the system measures speeds at the bottlenecks. If the traffic slows, the system transmits a reduced advisory speed to drivers approximately 1.5 miles upstream from the location of the slow-down.

Hourdos said many motorists mistakenly believe the speed displayed on the signs is either a reflection of the speed on the current stretch of highway or an indication of the speeds on the highway ahead, rather than a suggested speed for them to follow.

The requirement to display the same speed limit on all signs also compounds the problem, Hourdos said, because when drivers see that the slowdown is only occurring in certain lanes they tend to ignore the signs altogether.

“In the lane that is congested, the real speeds drop much faster than what the VSL system can respond to, reducing the functionality of the system to the eyes of the drivers,” Hourdos said, “while on the fast-moving lanes, it seems the system has no purpose at all.”

From downtown Minneapolis rooftops, traffic monitoring cameras detect shockwaves on Interstate 94.
Data was primarily collected via cameras at the I-94 Commons’ Third Avenue Field station, overlooking an area with a particularly high crash rate.

So is the I-94 VSL system useless? Not necessarily. For one, the new study didn’t measure the system’s impact on congestion — only its ability to reduce crashes on a small portion of I-94. Moreover, the area in question, the I-94 Commons, is fairly unique, having two major bottlenecks, the highest crash rate in the state (nearly one every other day), and five hours of congestion during the afternoon rush hour alone.

“The VSL system was designed for implementation on any freeway and may not have been well-suited for the I-94 Commons area, which is a very complex corridor with high volume weaves and significant shockwave activity,” said MnDOT Freeway Operations Engineer Brian Kary.

Generally speaking, the VSL system was designed to identify slow traffic ahead of where free-flowing traffic is approaching slow or stopped traffic.

“The crash problems within the commons are caused by speed differentials between lanes and shockwave activity within the congestion,” Hourdos said. “The current VSL system was not developed to handle these types of conditions.”

MnDOT and the researchers aren’t giving up, either. A new project is starting later this year to develop and deploy a queue warning system specifically for this high-crash rate location.

Further resources

Investigation of the Impact of the I-94 ATM System on the Safety of the I-94 Commons High Crash Area (PDF), May 2014

Improving Traffic Management on Minnesota Freeways (PDF), May 2012

Study to develop bridge load limits for tractors

Minnesota farm equipment is getting larger and heavier, causing strain on rural bridges. However, there are no  nationally recognized specifications for what size and weight of tractors can safely travel over them.

Currently, bridge load limits are based off semi-trucks, not farm machinery, which have much different axle configurations and wheel dimensions.

“Their geometry is atypical; their length, widths are different; they have different suspension characteristics,” explains Brent Phares, director of the Bridge Engineering Center at Iowa State University.

A new pooled fund study led by the state of Iowa is attempting to determine how much stress heavy farm vehicles put on bridges. This data will be used by local agencies to develop weight restrictions specifically for farm equipment.

“It will help limit the confusion of current load posting signs for farmers,” said MnDOT bridge load rating engineer Moises Dimaculangan.

Wisconsin, Minnesota, Nebraska, Oklahoma, Illinois, Kansas and the United States Department of Agriculture are also participating in the study, which is examining three types of local bridge superstructures: those with steel girders and concrete decks; bridges with steel girders and timber decks; and timber bridges with timber decks.

Through physical testing and modeling, the study will determine how different types of farm machinery distribute their loads on the bridge superstructure.

About a half-dozen farm vehicles were tested on 20 different bridges which were representative of those tending to be the most problematic for farm equipment traffic on secondary road systems, Phares said.

Instrumentation measured the response of the structures to the vehicles. This data was then used as a baseline to calibrate analytical models, which could be applied to 250 different bridges and 121 different farm vehicles.

Researchers will develop a generic tractor profile, which represents the worst-case scenario, for use in determining load limits. With the information developed, signs might be able to be added to the bridges, which show a tractor and the weight limit.Collapsed bridge

“I get a number of pictures emailed to me of bridges that have failed with a tractor implement of husbandry on top,” Phares said. “That’s the problem that people are looking to avoid; the goal isn’t to restrict the size of farm vehicles, but to develop better tools for engineers to make sound and solid analyses for the bridges, so they can provide that information to the people who need to have it.”

Phares said a couple previous studies have also looked at farm machinery weight restrictions. One study, from around 2004, took a high level look at the impact of farm vehicles on bridges. A more recent pooled fund study analyzed the impact of machinery on pavements.

Related resources

Research in Progress: Study of the Impacts of Implements of Husbandry on Bridges

The Effects of Implements of Husbandry “Farm Equipment” on Pavement Performance

MnROAD 2014 Peer Exchange (photo gallery)

MnROAD is hosting pavement researchers from around North America this week to discuss research conducted at its cold weather pavement testing facility in Albertville, Minnesota.

Participants at the three-day conference (June 10 to 12) are reviewing the findings of recent pooled fund studies, sharing their implementation experience and recommending what projects should be picked for the next round of research.

Bob Orthmeyer from the Federal Highway Administration, said MnROAD was the only facility in the country that could supply several test sections needed for a recent study.
Bob Orthmeyer from the Federal Highway Administration said MnROAD is the only facility in the country that could supply several test sections needed for a recent study.
Graig Gilbertson from MnDOT District 8 listens to one of seven presentations Tuesday on the latest research.
Graig Gilbertson from MnDOT District 8 listens to one of seven presentations Tuesday on how agencies have implemented MnROAD’s second phase of research projects.
Stephen Lee shares the Ontario Ministry of Transportation's experiences during a discussion Tuesday on research implementation.
Stephen Lee shares the Ontario Ministry of Transportation’s experiences during a discussion Tuesday on research implementation.
Steve Bower, a Michigan Department of Transportation Research Engineer, visits with MnROAD researcher Bernard Izevbakhai, right, and others during a break.
Steve Bower, a Michigan Department of Transportation Research Engineer, visits with MnROAD researcher Bernard Izevbakhai, right, and other peers.
Construction engineering professor Joe Mahoney, from the University of Washington, leads a group discussion on improving research efforts at the close of the session Tuesday.
From left, Dave VanDeusen from MnDOT, LaDonna Rowden from the Illinois Department of Transportation, Magdi Mikhail from the Texas Department of Transportation and Samy Noureldin from the Indiana Department of Transportation. — at Holiday Inn Bloomington I-35W.
From left, Dave VanDeusen from MnDOT, LaDonna Rowden from the Illinois Department of Transportation, Magdi Mikhail from the Texas Department of Transportation and Samy Noureldin from the Indiana Department of Transportation.
Researchers came from Missouri, Maine, Texas, Illinois, Michigan, California, Ontario, Wisconsin, Indiana and Washington for the three-day workshop.


Rumble Strips vs. Mumble Strips: Noise Comparison (Video)

We recently blogged about a research project to evaluate a new type of rumble strip that produces significantly less external noise than traditional designs. The above video, shot near Thief River Falls, Minnesota, shows a comparison between traditional rumble strip designs and the newer, “sinusoidal” rumble strips (a.k.a. “mumble strips”).

The life-saving benefits of rumble strips are well-established, but traditional designs produce external noise that residents consider to be a nuisance. The issue has pit safety concerns against quality-of-life concerns in some parts of the state. Researchers are investigating whether sinusoidal rumble strip designs, which are much quieter, are effective enough to combat drowsy or inattentive driving.

The video is not exactly a scientific comparison, but it does give the viewer a good sense of the difference in noise levels produced by the two styles of rumble strips. The results of the actual research project are expected to be available later this year.

Back to gravel? As dollars shrink, counties look for solutions

A large percentage of Minnesota’s local highways were built in the 1950s, the same era that birthed the modern interstate system. But the golden age of highway construction has caught up to counties, who are struggling to maintain and rehabilitate aging road systems with fewer and fewer dollars.

“Our economic resources do not meet the financial investment needed as the bulk of our pavements surfaced in the 1950s reach the end of their useful life all about the same time,” said Freeborn County Engineer Susan Miller.

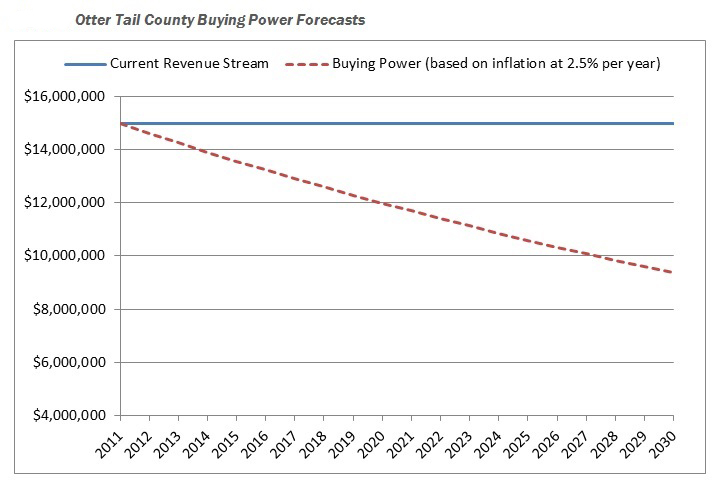
In rural Otter Tail County alone, the cost of road construction has climbed 10.5 percent per year for the past 10 years.

Meanwhile, there has been only one increase in funding — an 8.5-cent bump in the state gasoline tax “that was eaten up the moment it was enacted,” said County Engineer Rick West.

Otter Tail’s funding gap? An estimated $11 million in year 2011 alone.

With no change in sight, counties across the state are banding together in a research project through the Local Road Research Board to identify ways to reduce the size of their road systems and lower preservation costs.

Forced into a corner

The LRRB launched the study at the behest of counties who were considering turning some paved highways back to gravel just to get by — even though it would probably increase long-term maintenance costs.

In addition to providing expertise on that topic, consultants worked with a group of pilot counties to develop other strategies of stretching county road dollars further. These include: changing maintenance schedules; using different gravel road materials; transferring roads to city or township ownership; adopting different road performance measures; and raising local revenue.

“This project of how five different counties approach funding limitations and how to manage a system with constrained resources is one of the best that I have been a part of through the LRRB,” said Miller, who found the data critical to convincing her county board to pass a wheelage tax.

ottertail2

A new way of thinking

Although the ideas developed through the study aren’t entirely new, for a busy county engineer with few staff, the assistance to implement them has been very valuable.

“We’re practitioners — not researchers,” said Otter Tail’s Rick West. “It’s really forced us to look at our system in its entirety and from a long-range perspective. For us, that’s huge.”

The LRRB selected pilot counties (Dakota, Otter Tail, Freeborn, Stearns and Anoka) that reflect the diversity of the state. After researchers help them implement their chosen strategies, they will hold informational workshops for others throughout the state.

“Other counties with similar roadway preservation issues or management structures can follow these best practices,” said Michael Marti of SRF Consulting Group. “There are a lot of tools out there, there just needs to be more demonstration or training on each of these tools.”

Anoka County, for example, undertook a detailed analysis to determine which roads should become city-owned and which roads the county should assume.

The evaluation system used by Anoka, which examines travel data and other factors, could be adopted by other counties.

Public education

While some ways of changing the system of road maintenance may not be immediately popular, the community will get on board if they understand why, said Otter Tail County Board Chairman Wayne Johnson.

For instance, Otter Tail had to explain why it’s more cost-effective to sealcoat four-year-old roads than reconstruct beat-up, low-volume roads.

“That’s hard to get your arms around when it’s been the other way for 50 to 60 years,” Johnson said.

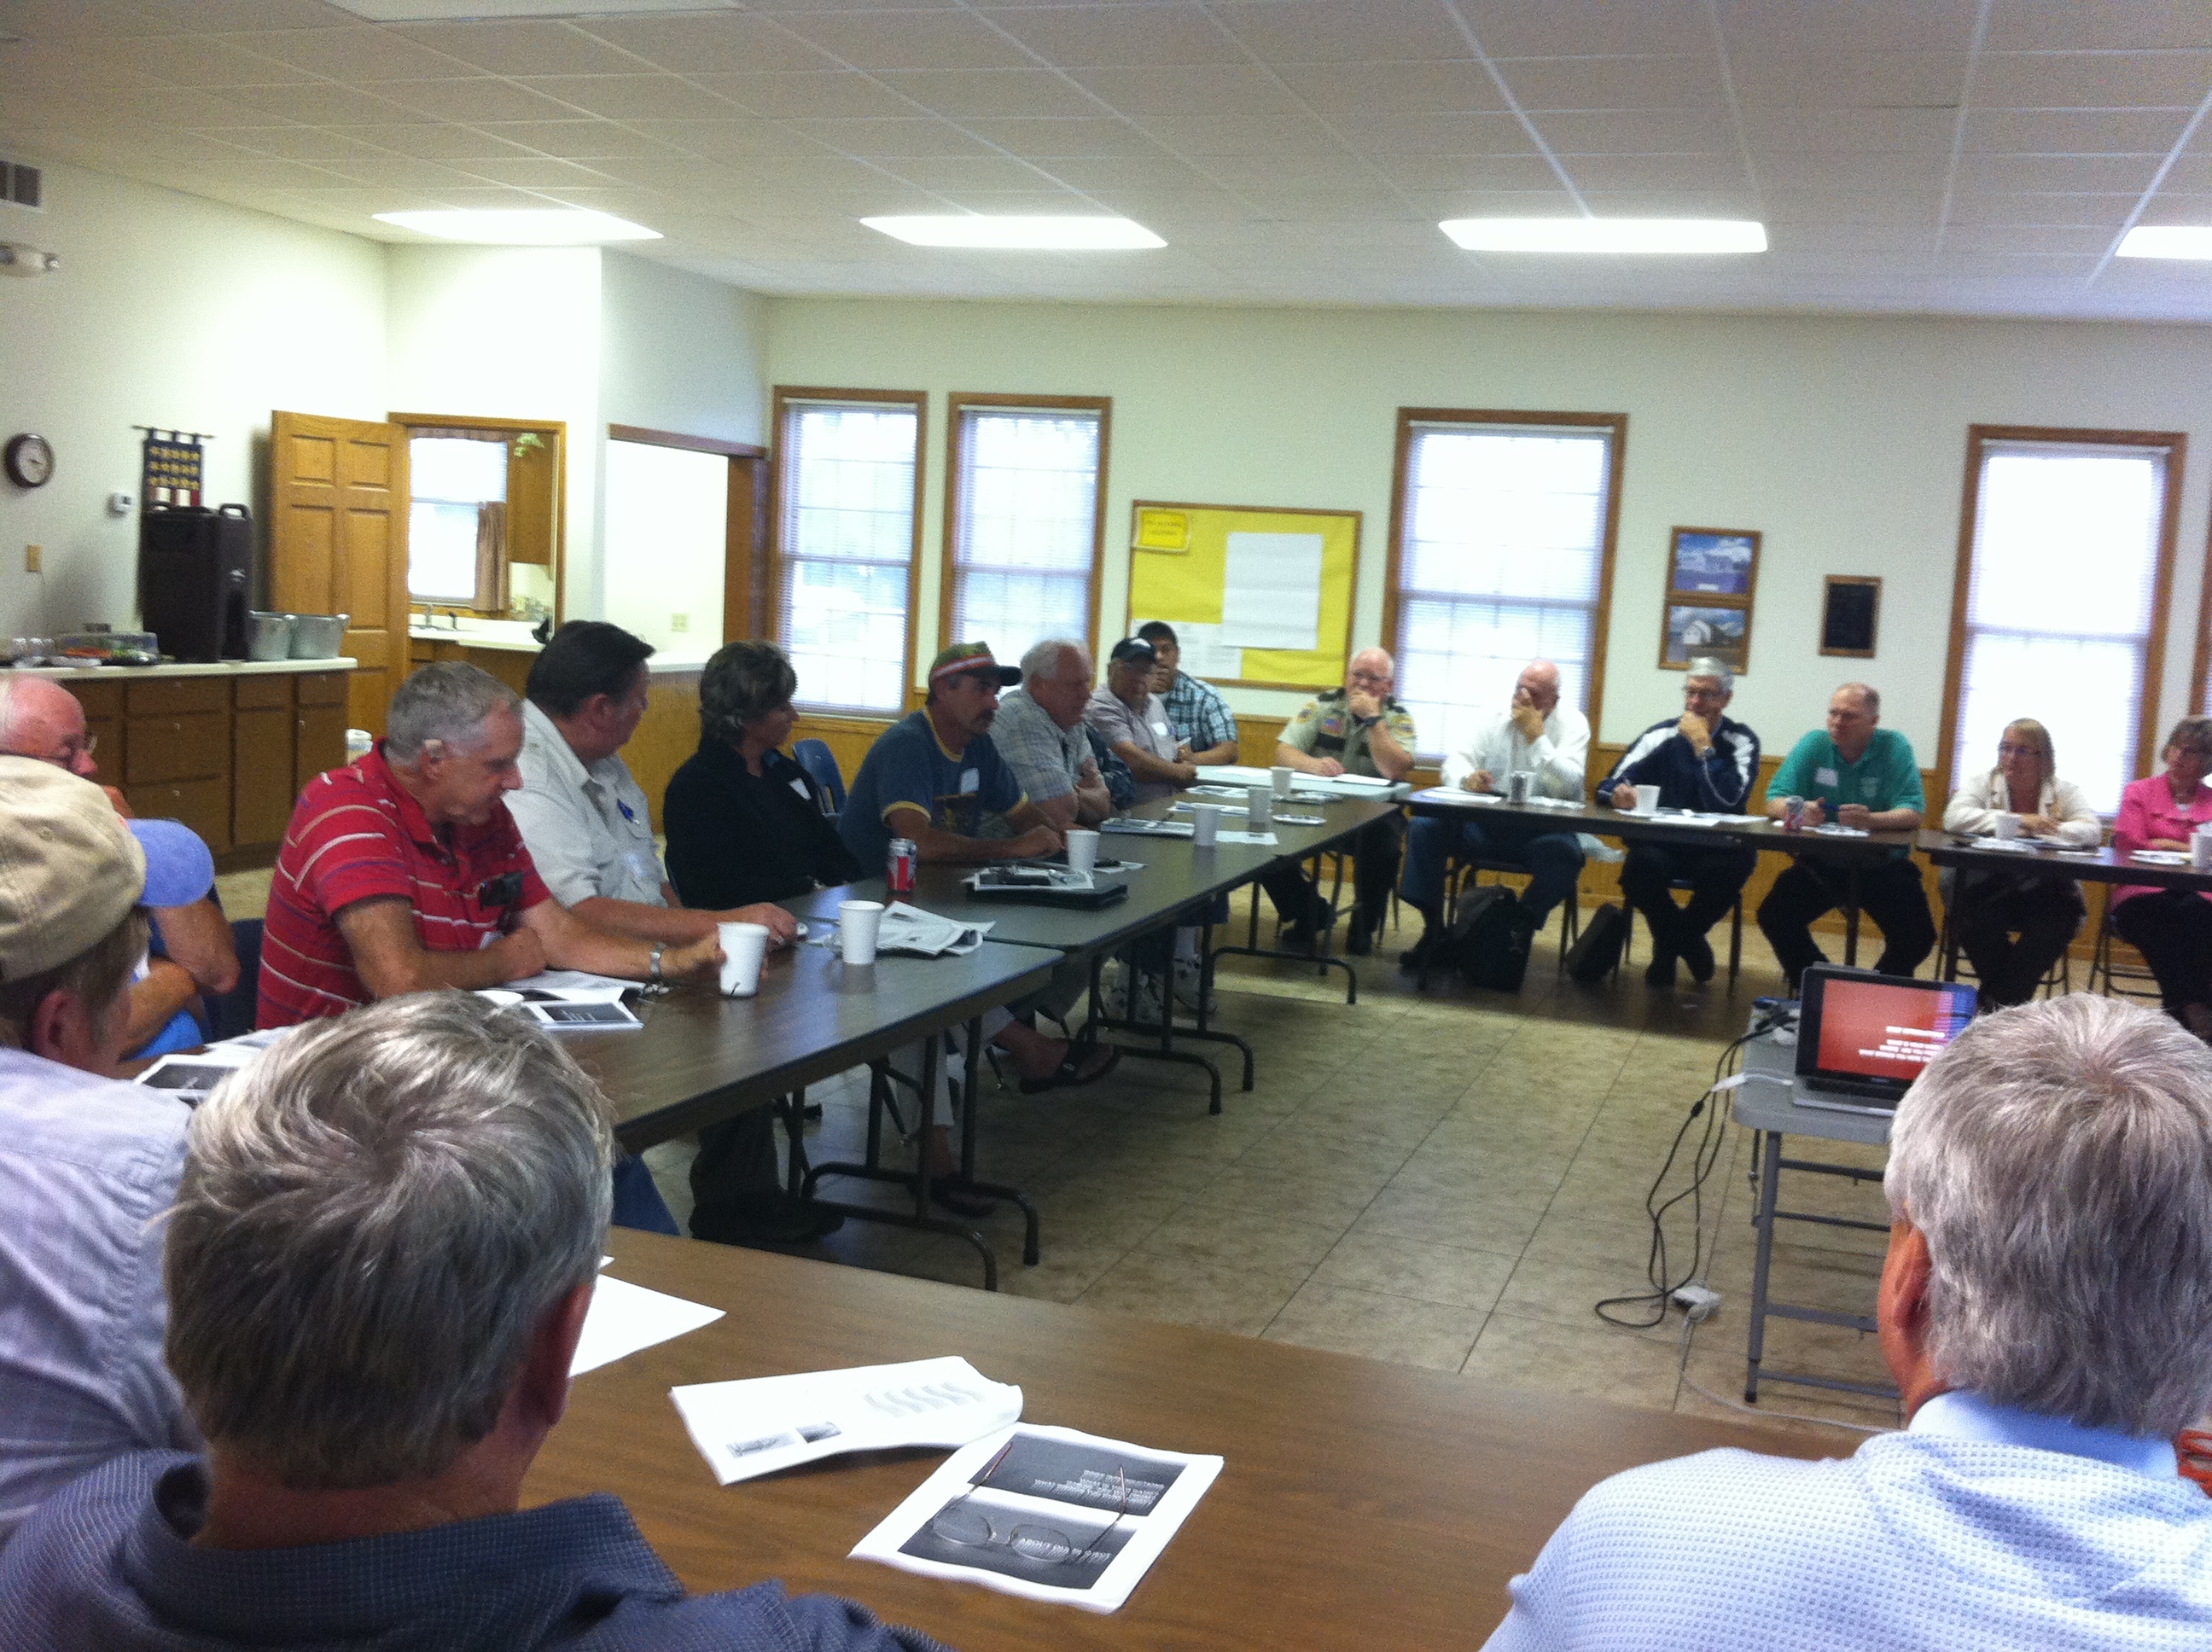
Community residents did, however, reject one possible strategy discussed at eight public outreach meetings: unpaving roads.

Otter Tail’s entire county road network is paved — a reflection of investments made back in the 1950s that have become somewhat of a community ethic for Ottertail’s 57,000 residents (a population that triples during the summer).

Tools used in the study enable counties to illustrate just how far behind they are in terms of maintenance and prioritize where to make improvements.

“Everyone wants roads to be maintained, but until the road system preservation study, nobody understood the magnitude of the funding gap between where we are and what we need to do to preserve the system,” said Johnson, who recently shared his county’s findings at the National Association of County Engineers conference.

The data is critical for the public to understand why a county might seek a local tax or different method of road maintenance.

“It’s far better to try to tell them what the problem is on the front end, rather than defend the decision on the back end,” Johnson said. “We’re after them to buy into something because it’s their roads and their money.”

Resources
  •  The project findings will be completed later this year and available on the LRRB’s website.

What’s the life of a sign?

Traffic signs provide important information to drivers, and are a critical component of traffic safety. In order to be effective, their visibility and readability must be maintained under both day and night conditions.

Key to signs’ effectiveness is a quality known as retroreflectivity — the ability for signs to bounce light back toward a driver’s eyes, making them appear brighter and easier to read.  Retroreflectivity deteriorates with time, so transportation agencies need to actively maintain their signs.

A research project funded by the Local Road Research Board is developing a guide to help cities and counties better manage their signs, and also to meet a new Federal Highway Administration retroreflectivity management requirement while getting the lowest life-cycle costs.

Cities and counties have until June to establish a sign assessment or management method that will maintain minimum levels of sign retroreflectivity.

“Right now there’s a mixture of different management methods, with very little guidance as to what’s appropriate for your agency based on the signs you have and your labor force and equipment,” said Matt Lebens, a MnDOT research project engineer.

Since 1993, the Manual on Uniform Traffic Control Devices has included guidelines for minimum retroreflectivity of pavement markings and signs. The standards are meant to ensure that drivers, especially the growing population of elderly drivers, are able to detect, comprehend and react to traffic signs. The LRRB project is designed to help fill certain knowledge gaps in this area.

Measuring retroreflectivity

Possible methods for ensuring retroflectivity include night-time inspection; use of a reflectometer; spot-checking a sampling of signs that are the same age; or blanket replacement of signs once they reach a certain age.

Although the retroreflectivity of a sign is  guaranteed by its manufacturer to last a certain number of years, it commonly lasts much longer.

“Currently, we don’t have expected sign life guidance for agencies to use. Through this project, we are establishing a control deck for sign sheeting used in the state, and an expert panel will make recommendations on expected sign life ranges,” Lebens said.

Researchers reviewed retro-reflectivity studies from other states and also measured the retro-reflectivity of signs out in the field across Minnesota using a retroreflectometer. As part of this project, MnDOT is providing training on the retroreflectometer and will also make it available for loan to local municipalities. (Watch a video demonstration.)

At MnDOT’s MnROAD site,  control decks contain dozens of signs. In addition to measuring retroreflectivity, the MnDOT Materials lab is monitoring color fade, which has been a larger issue in Minnesota.

“By getting better data as to the real life in-field life span of the signs, agencies will have a more realistic and better informed value for sign life expectancy, as well as potentially reducing costs,” said MnDOT Senior Engineer Mark Vizecky.

Expected life

There’s been no definitive studies to date as to what the life of a sign is, said lead project investigator Howard Preston of CH2M Hill, but the research so far shows it is in well excess of manufacturer warranties.

Cities and counties will be advised to pick an expected sign life that goes beyond the warranty – and then stay tuned.

“The notion is to watch these signs until they fail,” Preston said. “The sheeting material is better than it used to be. The failure might be 20 or 30 years out.”

There are two basic types of reflective sheeting material: beaded and prismatic.

Although beaded is guaranteed to last 10 years, researchers anticipate a retroreflectivity life of between 12 and 20 years old.

For the prismatic material – which has a 12-year warranty – the life cycle is anticipated to be 20 to 30 years.

“Nobody knows for sure, because nobody has actually followed this material to failure in a controlled condition,” Preston said. “On the road, there are so many variables: vandalism, knock-downs, etc.”

A test deck at MnROAD.
Researchers look at the test deck at MnROAD. The study panel includes city and county engineers.
Resources

Traffic Sign Life Expectancy study – Technical Summary (PDF, 1 MB, 2 pages); Final Report (PDF, 2 MB, 45 pages)

Optimizing traffic counters could net big savings for MnDOT

The design of long-lasting roads requires knowing how many cars and commercial trucks travel over them. To collect this data, engineers rely on traffic counters.

But at a cost of $50,000 to $200,000 each, MnDOT must be judicious about where it places its permanent automatic traffic recorders (ATR) and weigh-in-motion (WIM) sites.

In a new MnDOT-funded research project, University of Minnesota researchers are studying how to optimize ATR placement and other collection methods to improve the quality of the data while reducing costs.

ATRs and WIMs are devices embedded in the pavement surface that continuously collect traffic data.  The state has 91 ATR/WIM sites, as well as 32,500-plus short-duration (i.e. “short-count”) sites where traffic data is collected for 48-hour periods and then used to estimate average daily traffic counts.

“We place permanent traffic counters at key locations across the state and try to logically apply patterns from them to similar locations across the state,” explained MnDOT Project Advisor Alan Rindels. “Short-count locations draw on seasonal patterns from individual or clusters of ATRs to convert 48-hour counts into annual average daily traffic estimates.”

Traffic analysis

The information collected is used by MnDOT’s Traffic Monitoring Unit to analyze traffic patterns and travel trends. An increase in traffic may cause the department to consider increasing the number of lanes or add a traffic light to an intersection that becomes busier. The data is also submitted to the federal government to determine highway funding.

Fifteen WIM sites also collect axle loadings, vehicle and axle configuration and truck volume characteristics. This information is useful for pavement and bridge design, as well as size and weight enforcement.

It’s too early to say what the ultimate outcome of the study will be, but University of Minnesota researcher Diwakar Gupta believes it may involve reducing the number of permanent count locations, while increasing the frequency of counts at short-count locations — which are deployed only once or twice every two, four, six or 12 years. He said research is showing that these snapshots in time may be insufficient for short-duration locations with seasonal commercial truck traffic.

Another option may be retaining all the permanent ATRs, but only collecting data from them every few years. This could reduce site maintenance costs and the manpower needed to analyze continuous traffic count data.

Researchers are also looking at how to better match short-count sites with individual or groups of continuous count locations to improve the accuracy of seasonal adjustments that are used to create annual estimates.

“We think, in the end, Traffic Data Management will transition to a different way of sampling and collecting data,” Gupta said.

A Weigh-In-Motion traffic counter on Highway 52 in South St. Paul.
A Weigh-In-Motion traffic counter on Highway 52, between the Lafayette Bridge and I-494.

Emergency alternate route selected in I-35 pilot project

When a semi carrying millions of bees crashed three years ago on Interstate 35,  a five-mile stretch of freeway near Lakeville  had to be shut down, and it took several hours to re-open.

A new pilot project under way in southern Minnesota would move traffic more quickly during accidents like these by having a predetermined route along I-35 to redirect motorists.

Currently, when the Minnesota State Patrol decides to close a freeway, motorists are left to their own devices to determine where to go.

A sign similar to this will go up along the I-35 alternate route to guide redirected traffic.

“The use of emergency alternate routes are very helpful in rural areas where other roadway options might be limited,” said project consultant Andy Mielke of SRF Consulting, who helped the state of Wisconsin establish similar routes along its interstate.

The MnDOT-funded research project establishes a permanent alternate route parallel to the interstate in Freeborn, Steele and Rice Counties.

MnDOT worked with local officials to identify the best alternative roads and is in the process of procuring signs to permanently affix along the I-35 alternate route this summer.

Picking a route

Identifying an emergency route wasn’t easy. Engineers had to consider the proximity to the freeway, whether a route was direct enough and whether the roads could handle heavy truck traffic.

A planning committee that included MnDOT, the State Patrol and three county engineers developed a route and procedures for everyone to follow.

“All of the responders know where the traffic is going, so they’re all operating off the same sheet of music,” Mielke said.

The alternate route system is intended to reduce traffic delays, minimize secondary crashes, speed the emergency response and keep truck freight moving during a large accident.

More than 5,000 trucks per day travel Interstate 35.

I-35EmergencyAlternateRouteMap
Proposed alternate route.

“If you’re a truck driver sitting in congestion, time is money,” Mielke said.

The planning team identified messages that can be automatically deployed on message boards along 35 during an emergency. The route will only be activated if the freeway is fully blocked or once all other methods of moving traffic are exhausted.

The interest for the project came from MnDOT District 6 Traffic Engineer Mike Schweyen, who participated in Wisconsin’s planning for an emergency alternate route in the La Crosse area.

An I-35 Corridor Emergency Alternate Route Operations Guide has been created. The route plans just need final approval now from the county boards.

This project could be an example for the rest of the state to follow. Other MnDOT districts are considering establishing alternate freeway routes in their districts.

Related Resources

Alternate route plans for Freeborn County, Steele County and Rice County (PDFs) (subject to final county board approval).

MnDOT Develops Best Practices Guide for Culvert Repair (Updated, with Video)

County engineers and MnDOT hydraulics engineers have to wear many hats. One of them is maintaining culverts — the channels beneath roadways that facilitate passage of water and wildlife.

But culvert maintenance is practically a field of knowledge unto itself. To help engineers identify and apply the best repair techniques for specific problems, MnDOT recently produced a best practices guide for culvert repair (links below).

“We wanted to develop a state-of-the practice and put it into one place so engineers could easily find the information they need,” said Lisa Sayler, MnDOT Assistant State Hydraulic Engineer.

It might not always be the most visible or exciting issue from the public’s perspective — although, as the video above illustrates, occasionally it can be very visible — but culvert repair is a critical issue for transportation professionals. In fact, MnDOT submitted the repair guidebook as one of its choices for the AASHTO-RAC’s 2014 high-value research publication.

“There are many different fixes and products available for failing or deteriorating  pipes,” explained District 4 Hydraulics Engineer Jane Butzer, who requested the guidebook. “This guide steps through the different products and practices, and further assists the hydraulics engineer by providing special provisions and standard detail drawings to include in project plans.”

Culvert repair practices have evolved significantly in recent years, so it can be difficult for individual engineers to keep abreast of new practices that come from a wide variety of sources. The guidebook draws from a wide range of sources, including the Federal Highway Administration, the National Cooperative Highway Research Program, AASHTO and numerous state DOTs.

“We synthesized previous work and expanded it from there to provide more details and more quantitative guidance for some specific repairs. We tried to provide more specific design procedures than what we found in previous documents,” said project manager Bruce Wagener of CNA Consulting Engineers.

In addition to providing detailed explanations of rehabilitation and repair methods, the guide includes a table that compares most methods of repair.

Researchers will next conduct a brief feasibility study to identify which culvert repair methods can be observed and tested to document the cost, longevity and effectiveness of repairs.

Sliplining, a common culvert rehabilitation method, involves inserting a fiberglass pipe liner (shown) or other material into a deteriorated culvert.
Resources