Darkness in Box Culverts Not a Likely Barrier to Topeka Shiner

Darkness box culverts does not present a complete barrier for southwestern Minnesota fish species, according to a new MnDOT study. The findings will reduce the cost and  delay of future box culvert replacement projects.

“This research will allow MnDOT to save both time and money when replacing other box culverts in southwestern Minnesota by eliminating the need for a fish passage study for each one,” said Scott Morgan, Principal Hydraulics Engineer, MnDOT District 7.

The research project is one of several undertaken by MnDOT and the Local Road Research Board to better understand fish passage (more at mndot.gov/research), and ultimately develop a Minnesota culvert design manual for accommodating aquatic species.

What Was Our Goal?

In this study, researchers developed several objectives in their efforts to assess the effect of low light levels on fish passage through replacement box culverts. As part of this effort, they wanted to determine typical light levels in the replacement culvert and other box culverts in the region. They also sought to determine if the Topeka shiner and other fish move through culverts in the same numbers they pass through control areas in the same stream, and whether light levels affect frequency of movement. Finally, if a barrier is determined, researchers sought to design or recommend a method for mitigating light in the culvert.

What Did We Do?

In the field, researchers characterized light in long box culverts (at least 8 feet by 8 feet) by collecting many light levels with a light meter at the water surface within the three culverts and at control reaches. They also measured light levels within the water column to characterize the light conditions a fish would experience.

To determine whether Topeka shiners passed through culverts in similar numbers as through control reaches of the same stream, and whether light levels affected their passage, researchers employed a mark-and-recapture process. They caught fish upstream and downstream from the culverts or control reaches, marked them with an identifier indicating where they were caught and released, and then resampled to see where fish moved. They also noted other culvert features that could affect passage, such as water depth and velocity.

Image of fish tank.
In light manipulation experiments at the St. Anthony Falls Laboratory, Topeka shiners and fathead minnows were allowed to choose channels to swim along. The degree of shade in one channel was adjusted from light to deep shade.

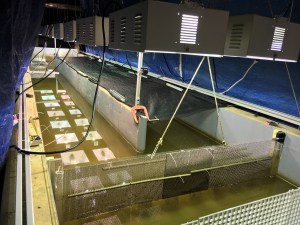
To control for confounding variables that could affect fish movement, a laboratory study measured Topeka shiner preference for light or dark channels. Researchers used a 25-foot-long double channel box with water diverted from the Mississippi River. Fish could choose to swim along light or shaded lanes as they preferred in this light manipulation experiment.

What Did We Learn?

Although there has been increasing concern over the potential for culverts to create behavioral barriers for fish and other organisms, this was the first study that quantified these behavioral effects for fish passage. Light levels in large box culverts were not identified as a potential barrier to the fish communities present in southwestern Minnesota. Two out of the three culverts monitored showed reduced fish passage compared to the control reaches; however, fish—including Topeka shiners—were able to pass through all three.

The longest and darkest culvert had the greatest difference in movement between the culvert and the control, but this variation could not be attributed solely to light levels. This finding was supported by experiments at the St. Anthony Falls Laboratory, where fish that could select either a shaded or lighted channel showed no avoidance of the shaded channel regardless of the shading level.

The light measurements in three culverts yielded an extensive data set that can be used to model light levels through culvert barrels. Light levels at the water surface depended on the culvert entrance, dimensions, construction material, orientation and elbows, while light levels in the water column were also affected by turbidity.

What’s Next?

The conclusions of this study apply only to Topeka shiners and other small warm water fish species, and to large box culverts like those studied. Additional research is required to investigate possible barriers created by smaller, darker culverts to light-sensitive fish species and the interactions between light and other variables such as velocity.

This post pertains to Report 2017-44, “Culvert Length and Interior Lighting Impacts to Topeka Shiner Passage,” published November 2017. The full report can be accessed at mndot.gov/research/reports/2017/201744.pdf.

MnDOT installs safety countermeasures at stop signs, stop lights

MnDOT is working on ways to reduce crashes at intersections by making stop signs and stop lights more visible to motorists. The agency will apply reflective red metal strips on nearly 1,000 stop sign posts and fluorescent yellow tape around 100 traffic signal lights across the state this summer.

“We think these two low-cost safety countermeasures will help reduce crashes at these higher risk intersections,” said Derek Leuer, traffic safety engineer.

13-JuneSafetyMeasures_400
Derek Leuer, traffic safety engineer, displays what the yellow reflective tape looks like around the back plate of a traffic signal light. This tape will be installed on 101 signals statewide this summer. Photo by Sue Roe

The stop sign project will be implemented on locally owned roads that intersect with two-lane, two-way state highways. The highways chosen are considered moderate- and high-risk crash corridors.

The reflective red strips will be installed on the stop sign post directly beneath the stop sign.

Rural intersection crashes are a serious issue in Minnesota, according to Leuer. From 2008 to 2012, there were 533 serious and fatal injury crashes at rural state highway intersections.

“This project aims to reduce those fatal and serious injury crashes in the state by making the stop signs easier to see,” he said. “Fatal right-angle crashes often are the result of one or more drivers failing to comply with a stop sign.”

The traffic signal project includes installing fluorescent yellow tape around the rectangular back plate that contains the green, red and yellow traffic signal bulbs. Leuer said this is a proven Federal Highway Administration safety countermeasure already used by other states.

“The reflective tape will make the signals look bigger and help motorists be more aware of them,” Leuer said. “This will be especially helpful at night and in low-visibility conditions.”

The florescent yellow tape will go on signals at intersections that are considered higher risk for crashes and may have a record of past crashes.

Cost of both projects is about $500,000.

MnDOT will evaluate both projects for effectiveness on an ongoing basis over the next three years.

“The installation of red reflective strips to stop sign posts and yellow fluorescent tape around signal lights may become another low-cost tool to help MnDOT improve roadway safety and move Minnesota toward zero deaths,” Leuer said.

This article by Sue Roe originally appeared in the June 13, 2018 MnDOT Newsline.

Smartphone prototype app warns drivers of high-risk curves

Lane-departure crashes on curves make up a significant portion of fatal crashes on rural Minnesota roads. To improve safety, solutions are needed to help drivers identify upcoming curves and inform them of a safe speed for navigating the curve.

“Traditionally there are two ways to do this: with either static signage or with dynamic warning signs,” says Brian Davis, a research fellow in the U of M’s Department of Mechanical Engineering. “However, while signing curves can help, static signage is often disregarded by drivers, and it is not required for roads with low average daily traffic. Dynamic speed signs are very costly, which can be difficult to justify, especially for rural roads with low traffic volumes.”

In a recent project led by Davis on behalf of MnDOT and the Minnesota Local Road Research Board, researchers developed a method of achieving dynamic curve warnings while avoiding costly infrastructure-based solutions. To do so, they used in-vehicle technology to display dynamic curve-speed warnings to the driver based on the driver’s real-time behavior and position relative to the curve. The system uses a smartphone app located in the vehicle to provide the driver with visual and auditory warnings when approaching a potentially hazardous curve at an unsafe speed.

“Highway curves [make up] 19 percent of the total mileage of the paved St. Louis County highway system, yet these curves account for 47 percent of all severe road departure crashes,” says Victor Lund, traffic engineer with St. Louis County. “In-vehicle warnings will be a critical strategy to reduce these crashes.”

To begin their study, researchers designed and tested prototype visual and auditory warning designs to ensure they were non-distracting and effective. This portion of the study included decisions about the best way to visually display the warnings and how and when audio messages should be used. “To create the optimal user experience, we looked at everything from how to order the audio information and when the message should play to the best length for the warning message,” says Nichole Morris, director of the U’s HumanFIRST Lab and co-investigator of the study.

Next, a controlled field test was conducted to determine whether the system helped reduce curve speeds, pinpoint the best timing for the warnings in relation to the curves, and gather user feedback about the system’s usefulness and trustworthiness. The study was conducted with 24 drivers using the test track at the Minnesota Highway Safety and Research Center in St. Cloud, Minnesota. The selected course allowed drivers to get up to highway speeds and then travel through curves of different radii, enabling researchers to learn how sensitive drivers are to the position of the warnings.

Based on the study results, the system shows both feasibility and promise. “Our in-vehicle dynamic curve warning system was well-liked and trusted by the participants,” Davis says. “We saw an 8 to 10 percent decrease in curve speed when participants were using the system.”

The project was funded by MnDOT and the Minnesota Local Road Research Board.

Enhanced WIM Reporting Software to Improve Commercial Traffic Weight Monitoring and Data Sharing

An update to BullConverter allows MnDOT’s statewide weigh-in-motion (WIM) system to adopt systems from more manufacturers. The BullReporter upgrade adds new reporting functions, including a View Vehicles function that provides an image of a vehicle along with a graphical representation of WIM data, such as weight and speed.

This upgrade, developed through a research study, expands the commercial traffic information that the Office of Traffic System Management can provide to the MnDOT Office of Bridges and Structures, local and state permitting agencies, the Minnesota State Patrol and other Minnesota authorities.

“With BullReporter, now we can produce daily, weekly and monthly reports of the overweight vehicles that cross over WIM sensors,” Benjamin Timerson, Transportation Data and Analysis Program Manager, MnDOT Office of Transportation System Management.

What Was the Need?

Weigh-in-motion (WIM) systems measure characteristics of individual vehicles on the road, generating records of data that include vehicle type, speed, axle weights and spacing. When a vehicle crosses WIM sensors in the pavement, it triggers electrical signals that are transmitted to a WIM controller, which converts the signals into usable WIM vehicle data. A number of manufacturers produce WIM sensors and controllers, and each vendor employs its own methods of processing signals and producing proprietary WIM data.

Image of WIM Controller
Load sensors and loop detectors in each lane of traffic are connected to a WIM controller in a cabinet that also houses a communication device. A centralized server connects to each field WIM controller and downloads daily WIM data files, which are then processed through BullConverter/ BullReporter.

In 2009, MnDOT began using BullConverter/BullReporter (BC/BR) software with heterogeneous WIM systems. BC converts incompatible, proprietary data into a uniform comma-separated values (CSV) format. BR generates reports from the converted CSV data, allowing the analysis of WIM data over different systems.

Currently, MnDOT’s Office of Transportation System Management (OTSM) uses WIM systems from International Road Dynamics (IRD), but recently began evaluating systems from Kistler and Intercomp. In a current study, investigators are evaluating the use of Intercomp WIM controllers with Intercomp sensors, IRD controllers with Kistler sensors, and Kistler controllers with Kistler sensors. These new WIM system combinations require new conversion functions in BC.

What Was Our Goal?

The goal of this project was to upgrade the BC/BR software package by improving  existing functions and incorporating new functions that will convert Intercomp and Kistler formats to the Bull-CSV format and refine export functions in BC. MnDOT also wanted to expand data reporting capabilities and analytical options in BR, including a View Vehicles capability for analyzing individual vehicles.

What Did We Implement?

MnDOT funded enhancements to the BC/BR software package to include Kistler and Intercomp formats and develop new data retrieval, statistical assessments and report generation applications, including View Vehicles.

How Did We Do It?

MnDOT provided the original BC/BR developer with a detailed list of enhancements and new conversion and reporting functions. The team developed a new WIM data downloading tool for Kistler controllers that would connect the controllers through the Internet and download and archive the raw data. Developers added two new conversion functions in BC to support conversion from Kistler and Intercomp formatted data to CSV-formatted data. The team also updated the export function in BC.

Image of View Vehicles Report display
The View Vehicles report displays on-screen images of vehicles along with WIM data in graphics that include vehicle class, GVW, speed and ESAL.

The software team then added View Vehicles report, a new reporting function, to BR. View Vehicles allows queries of vehicle records under any combination of parameters, including lane numbers, date and hour ranges, class numbers, gross vehicle weight (GVW), speed range, axle weight ranges and warning flags. Retrieved vehicle data are then displayed in web or PDF formats with a digital photo of the vehicle and graphics of selected WIM parameters.

The team added histogram functions for GVW and equivalent single-axle load (ESAL), which would retrieve a set of vehicle data based on user-selected parameters and then plot a graph or produce a spreadsheet. Developers enhanced a few other elements of BC/BR, wrote a manual for editing classification schemes and trained OTSM staff on the editing procedures.

What Was the Impact?

Deploying the updated BC/BR software package has significantly helped MnDOT and other state agencies. OTSM now can produce many different reports with a range of user-selectable data queries that can be customized to share with the MnDOT Office of Bridges and Structures, the Minnesota State Patrol and overweight permitting offices.

Expanded GVW and ESAL data generated with the updated software can be used in evaluating designs for new bridge construction. Permitting offices can draw upon BR reports to request changed axle configurations of overweight vehicles to prevent bridge damage. OTSM can also provide reports and vehicle images for compliance activities to the MnDOT Bridge Office, permitting offices and the State Patrol.

In addition, the updated BC/BR can provide data on traffic volume and vehicle class to the Office of Traffic Safety and Technology, can inform design decisions by the Office of Materials and Road Research, and can offer a wide range of useful information to the Office of Freight and Commercial Vehicle Operations.

“This software allows us to use different WIM systems and generate reports and analysis by integrating incompatible systems. We added more capabilities in BullConverter and increased BullReporter functions from 40 to more than 60,” Taek Kwon, Professor, University of Minnesota Duluth Department of Electrical Engineering.

What’s Next?

BC and BR are now fully updated for current needs and are in use by OTSM. The upgraded software will be used until industry changes or new analytical needs arise at MnDOT.

This posting pertains to Report 2017-34, “Enhanced Capabilities of BullReporter and BullConverter,” published September 2017. The full report can be accessed at mndot.gov/research/reports/2017/201734.pdf.

Investment in Transportation is Linked to Job Creation in Minnesota Counties

A new study by the Local Road Research Board (LRRB) shows that transportation investments within a county can increase the local employment rate, while investments in trunk highways surrounding a county can also enhance county and regional employment.

The goal of this project was to quantify the relationship between transportation investment and economic development as it is represented in data showing the effect of  the investment on job creation in counties.

“The entire project was new and useful. It provided answers to questions about the benefits for counties building local roads, beyond getting traffic from here to there,”
said Bruce Hasbargen, County Engineer, Beltrami County.

Background

As federal resources for transportation development have declined, state departments of transportation and local organizations have needed to be selective in funding transportation projects, choosing those that generate the greatest local return on investment.

Transportation engineers and planners understand the positive effects new roadway projects have on local and regional economies. But to demonstrate these effects to elected officials who develop the budgets—as well as to the tax-paying public— they have needed supporting quantitative data.

Previous LRRB research has produced data linking transportation investments to increases in local property values in Minnesota counties. More analysis and information were required about the possible links between local transportation investment and other economic indicators, such as job creation.

What Did We Do?

After an initial literature search, researchers followed the methodology of the earlier study by gathering and examining data from several sources. The Minnesota County Finances Report yielded investment information. Since 1985, this report has collected information about grants and expenditures for county-managed local roads. MnDOT’s Trunk Highway Construction and Maintenance Costs provided data related to these expenditures collected from 1995 to 2012.

To determine transportation investment effects on job creation and employment, researchers used several comprehensive data sources to measure employment across the state and in counties: the Quarterly Census of Employment and Wages (which reports overall employment); County Business Patterns (which reports private employment only, based on business register data); and data from the Minnesota Department of  employment and Economic Development.

Researchers combined data on transportation investment, business patterns and socioeconomic conditions in Minnesota counties from 1995 to 2010. The data included the number of county business establishments, jobs in Minnesota counties by sectors and the amount of the annual payroll. Investigators also examined spatial (GIS-map based) data from counties.

By linking the data of county business patterns to expenditures on local roads and trunk highways, researchers performed statistical analyses and created an econometric model to address these questions:

• How does transportation investment affect the employment rate, aggregate employment (number of jobs) and annual payrolls in Minnesota counties?
• Which type of transportation investment—trunk highways or local roads—is more effective in job creation?
• Does the link between transportation investment and job creation differ between metropolitan and rural counties?

The model’s design controlled for unrelated factors that would affect employment rates, including population, age structure, population density, educational attainment and level of urbanization.

What Did We Learn?

The literature search showed evidence of connections between transportation projects and local economic development across many decades and countries, although the results were varied and not predictive.

The data analysis found that long-term transportation investments contribute to employment in Minnesota counties, including several positive and statistically significant relationships:

• A 1 percent increase in local road capital within a county is associated with a 0.007 percent increase in the employment rate in the county, holding constant various socioeconomic factors.
• A 1 percent increase in trunk highway capital in surrounding areas is associated with a 0.008 percent increase in the employment rate of a county, again holding constant various socioeconomic factors.

The impacts are significant but not substantial, which researchers say may be explained by the fact that most Minnesota counties are rural and already have relatively high employment rates. Moreover, not all areas are positively affected by these investments.

The overall findings are largely driven by rural areas, while the evidence for metropolitan and micropolitan areas is mixed.

The results suggest that in Minnesota it would be more effective to invest in rural areas compared to urban areas as far as employment growth is concerned.

“As federal transportation money decreases, state and local agencies must make difficult policy decisions with diminishing budgets. This research provides quantifiable data about the local and regional benefits of new roads, which agencies can use to promote and support transportation projects,” said Zhirong (Jerry) Zhao, Associate Professor, University of Minnesota, Humphrey School of Public Affairs.

Image of trunk highway 61
Investments in trunk highways, such as Trunk Highway 61 in northeast Minnesota, are associated with employment rate increases in the counties where improvements are built, as well as regional benefits.

What’s Next?

The results of this project provide an internal decision-making tool for local agencies. They also offer quantitative data in support of transportation investment to convey to elected officials and the tax-paying public. Although no follow-up research is currently planned, many further studies of this type are feasible. For example, studies could evaluate associative effects of transportation investment on other socioeconomic factors, such as sales tax bases, small business development, workforce specialization and public education.

This post pertains to LRRB-produced Report 2018-04, “Transportation Investment and Job Creation in Minnesota Counties,” published January 2018. The full report can be accessed at mndot.gov/research/reports/2018/201804.pdf.

Adding Snowplow Camera Images to MnDOT’s Traveler Information System

MnDOT installed network dash cameras and ceiling-mounted cameras on 226 snowplows, approximately one-quarter of MnDOT’s snowplow fleet. The cameras, integrated with the onboard mobile data computer and automated vehicle location equipment, automatically captured snapshots of road conditions during plowing. The snapshots were incorporated into several facets of MnDOT’s 511 traveler information system: the desktop and mobile versions of the website and the 511 app. Motorists and MnDOT alike found the project to be valuable, with the up-to-the-minute imagery helping members of the public and MnDOT’s maintenance staff make well-informed decisions during winter storm events.

“The largest barrier to implementation involved the development of the software package for integrating snowplow cameras into the current AVL system. It required a great deal of back-and-forth to get things right,” said oe Huneke, Maintenance Decision Support Systems (MDSS)/AVL Section Manager, MnDOT Office of Maintenance.

“We did research to make sure the cameras did not block drivers’ views, taking state and federal regulations into consideration, and we tested the cameras to make sure they were capturing images at the right resolution,” said Jon Bjorkquist, Maintenance Technology Development/ Implementation Coordinator, MnDOT Office of Maintenance.

What Was the Need?

Reliable information about road conditions during winter weather allows motorists to make informed travel decisions and helps MnDOT responders maintain roads. While meteorological updates on a winter storm and automated status reports on Minnesota’s snowplow fleet are important sources of data, they do not provide visual information about road conditions.

In 2015, a pilot project allowed MnDOT to take road condition pictures from cameras mounted on selected snowplows during winter storms. The system was limited, however. Few snowplows were outfitted with these cam-eras, images were not available to the public, and network infrastructure did not allow for easy scaling. A larger scale program was needed to capture road imagery taken from snowplows across Minnesota and to share the pictures with Minnesota motorists.

What Was Our Goal?

MnDOT sought to install cameras on a sizable portion of MnDOT’s snowplow fleet. In addition to making hardware and network enhancements to collect and compile the image data, MnDOT also set out to make the photos avail-able in near-real-time to its internal maintenance staff and the traveling public.

Camera mounted on the ceiling of a MnDOT snowplow cab.
To capture images of road conditions, MnDOT mounted cameras in the cabs of one-quarter of MnDOT’s snowplow fleet.

What Did We Do?

In 2015 and 2016, MnDOT installed network dash cameras and ceiling-mounted cameras on 226 snowplows, approximately one-quarter of the agency’s total snowplow fleet. The cameras, integrated with the onboard mobile data computer and automated vehicle location (AVL) equipment, automatically captured snapshots of road conditions during plowing. This system included the following key operational features:

  • The dash cameras automatically recorded images whenever the computer-AVL system was on.
  • The cameras recorded an image of the road ahead of the plow.
  • Images were taken once every five minutes and were only retained if the plow was moving at least 10 mph.
  • The cameras were capable of taking operator-initiated snapshots and video clips.
  • Video clips could be classified into three categories: accident, general interest or work zone.

The system sent the plow camera images and metadata (geolocation, plow, camera and conditions) to a MnDOT server upgraded to accommodate the data. MnDOT set a data retention schedule for mobile snapshots and video segments as well as the data server.

Plow images were incorporated into several facets of MnDOT’s 511 traveler information system, including the desktop and mobile versions of the website and the 511 app. Plow images plotted at 10-minute intervals on the 511 maps provided motorists with up-to-the-minute, easily accessible information on road conditions. The images were also incorporated into MnDOT’s internal website called Condition Acquisition and Reporting System.

What Did We Learn?

The project demonstrated the successful integration of various hardware, software and network systems, carrying the road weather imagery step by step from the cameras to the public 511 interface. The project also succeeded in scaling up an earlier, modest effort to furnish snowplows with cameras.

In addition, MnDOT collected input on the value of the cameras from a range of interested parties: the public, snowplow operators and supervisors, and MnDOT management staff.

The public response was overwhelmingly positive, with 319 Facebook users responding to a MnDOT post about the cameras. All the respondents used positive emote icons (“heart” or “thumbs up”). Several members of the public provided responses through Facebook and MnDOT’s “Contact Us” Web page about the value of being able to view actual road conditions, though others expressed concern about the cost of the system.

Surveys of MnDOT snowplow drivers and supervisors and interviews of MnDOT managers revealed that supervisors and managers had a largely positive view of the program as well. Drivers provided mixed reviews. Comments from these groups yielded the following recommendations about implementing a program of this nature:

  • Perform outreach efforts that clearly communicate benefits to achieve broad buy-in from snowplow drivers. Provide training and follow-up instruction on use of the cam-era’s features to encourage drivers to use the manual snapshot and video features.
  • Address drivers’ concerns about privacy (such as “Big Brother is watching”) directly, and understand that these concerns have lessened over time. Supervisors should be advised not to react too quickly to privacy concerns.
  • Address concerns about in-cab distraction by adjusting the system configuration or hardware. This might include making dash camera screens dimmable at the driver’s option, or placing screens and cameras out of critical sightlines.

What’s Next?

This project was a success, with snowplow camera images providing significant benefits to MnDOT staff and the traveling public. Based on this work, MnDOT plans to install camera systems on additional snowplows in the state fleet—as deemed necessary by district management—and to continue displaying snowplow images on MnDOT’s 511 system.


This post pertains to Report 2017-41, “Installing Snowplow Cameras and Integrating Images into MnDOT’s Traveler Information System,” published October 2017.

New video traces progress of accessibility research

CTS has been celebrating its 30th anniversary this year with a look back at significant milestones. One of our goals for the anniversary was to show how research progresses over time to lead to new knowledge.

In February we shared videos that trace the path of progress in two of our key research areas: traffic operations and pavement design. Today, at our 28th Annual Transportation Research Conference, we debuted a video about another important research topic: accessibility metrics.

In the new video, Andrew Owen, the director of the U’s Accessibility Observatory, explains how accessibility looks at the end-to-end purpose of transportation: fulfilling people’s need to reach destinations. “The Observatory is pushing the envelope and staying ahead of research into what new types of metrics are possible,” he says.

The Observatory builds on tools and expertise developed in two previous University research studies: the Transportation and Regional Growth Study (1998–2003) and the Access to Destinations study (2004–2012).

Establishment and Care of Salt-Tolerant Grass on Roadsides

Kentucky bluegrass, the grass species that MnDOT typically uses for roadsides, was sensitive to salt; many installations could not tolerate winter deicing salts and died. Research on salt-tolerant grasses begun in 2009 resulted in MNST-12, a grass mix of fine fescues (with 20 percent Kentucky bluegrass for sod cutting, transport and installation stability) that is more salt-tolerant. MNST-12 was installed at many roadsides sites but by 2013, many MNST-12 installations were not thriving. Research into the reasons for these failures and the ways to best establish and care for MNST-12 revealed that this salt-tolerant grass mix requires a different planting and irrigation regimen than the standard MnDOT protocols that had been used for decades on Kentucky bluegrass. When installed as seed, MNST-12 should be planted in August or September; when installed as sod, it can be laid between May and November if sufficient irrigation is available. MNST-12 roots slowly and needs a particular irrigation regimen in early stages. Moisture replacement of 60 percent of its evapotranspiration rate is sufficient to promote establishment.

“The [highway] construction critical path for program delivery rarely includes a biological requirement for establishing vegetation. For salt-tolerant fescue grasses, planting dates and irrigation regimens matter,” said Dwayne Stenlund, Erosion Control Specialist, MnDOT Office of Environmental Stewardship.

“Basing irrigation approaches on evapotranspiration could reduce water consumption and, ultimately, the cost of establishing areas by sod,” said Eric Watkins, Professor, University of Minnesota Department of Horticultural Science.

Failed Kentucky bluegrass along a roadway
Because of its poor salt tolerance, Kentucky bluegrass has failed at many roadside sites in Minnesota.

What Was the Need?

Minnesota has more than 24,000 acres of green, grassy roadsides, ranging from street terraces to Interstate high-way medians. These roadside environments have many stressors, including heat, drought, insects, weeds, traffic and salt.

MnDOT has traditionally used Kentucky bluegrass for turfgrass, but its poor salt tolerance has resulted in many failed installations. Seed and sod research begun in 2009 produced MNST-12, a salt-tolerant grass mix of mostly fine fescues. By 2013, however, many roadside installations of MNST planted under MnDOT’s standard turf care protocols had failed and the reasons were unclear.

Replacing an acre of failed sod costs up to $25,000. MnDOT needed to learn why the turf failed and find the right methods to establish and care for salt-tolerant grass.

What Was Our Goal?

Researchers sought to assess installations of MNST seed and sod across the state to determine the planting and care practices that resulted in successful establishment or in failure. They also wanted to identify best practices for salt-tolerant turf establishment and care.

What Did We Do?

The study had two phases. In the first phase, researchers identified 16 roadside sites located throughout the state with salt-tolerant turf that had failed or performed poorly. They assessed these sites from July 2013 through 2014, and gathered detailed information about the sites from MnDOT, landscape contractors, sod producers and weather data sites. Information included date and time of installation, sod or seed used, temperature and precipitation at installation, and irrigation and mowing protocols. At each site, researchers also took measurements of ground cover, salinity, temperature, moisture content, surface hardness and depth of soil to top of curb. Soil samples were tested for pH, available phosphorus and organic matter.

Beyond variations in soil moisture, it was unclear whether any other soil aspect promoted the success or failure of site turf. Homeowners at various locations suggested that installation date and supplemental irrigation might have influenced a site’s success.

In the second phase of the study, investigators identified the best management practices for MNST by examining three factors that could influence turf performance:

  • Use of soil amendments during establishment. Researchers examined the effects on MNST performance of seven types of soil amendments, from slow-release fertilizers to various composts, used in trial plots.
  • Timing of seed and sod installations. Subsections of large trial plots at St. Paul and Blaine, Minnesota, were seeded or sodded monthly starting May 1 through Nov. 1. The watering regimens followed MnDOT’s 2014 specifications.
  • Post-installation watering regimens. Researchers planted sod plots of MNST and Kentucky bluegrass in a controlled outdoor area using an automatic sheltering system that protected the test areas when it rained. Irrigation was carefully controlled to test seven watering regimens. Researchers studied turf cover, root growth and shear strength of grasses at the sites.

What Did We Learn?

Soil amendment treatments had little effect on turfgrass performance, whether the plots were seeded or sodded.

MNST planted as seed cannot tolerate the heat and frequent drought conditions of Minnesota’s summers during establishment. Seeding should therefore only occur in August and September. Sod may be laid between May and November, provided there is adequate irrigation.

MNST differs biologically from Kentucky bluegrass and has different watering needs. Root development occurs more slowly and requires a longer period of irrigation during establishment, thriving with moisture replacement between 60 and 100 percent of the evapotranspiration rate. With adequate water, MNST establishes well.

MNST should not be mown until roots are established several inches into the soil profile. Drought-stressed turf should not be mown.

What’s Next?

Revisions to MnDOT’s specifications and guidelines are needed. In addition, MnDOT will need to adjust its previous recommendations for watering MNST-12 sod to ensure a successful installation. Further, guidelines for designers and inspectors must be updated. MNST is a different grass community than Kentucky bluegrass–dominated sods: The perception of what “success” looks like must be changed, and this change can be best accomplished through images. New methods of irrigation will need to be devised and implemented. Providing water only as the plant needs it could result in considerable savings in water and labor over time. Additional studies related to best management practices are pending.


This post pertains to the LRRB-produced Report 2017-31, “Best Management Practices for Establishment of Salt-Tolerant Grasses on Roadsides,” published July 2017. 

Design Considerations for Embankment Protection During Overtopping Events

Roadways in Minnesota’s Red River watershed are prone to flooding and overtopping, where wide flows of water wash across the surface of the roadway. Repairing the resulting damage to roadway embankments can be costly and time-consuming, requiring lengthy road closures. Protecting roads from destructive scour could significantly reduce the cost and time of repairs after a flood event. Researchers investigated three “soft” design methods using full-scale models and field monitoring, with flexible geogrid mat providing the best erosion protection. Regardless of protection technique, any physical separation from the soil beneath led to failure by creating a pathway for water to follow. Establishing root growth and vegetation would improve the performance of all techniques by anchoring the soil.

“This project developed a fairly complete matrix of useful erosion protection measures that our own staff can implement—techniques that are less elaborate and more cost-effective than hiring contractors,” said J.T. Anderson, Assistant District Engineer, MnDOT District 2.

“This project was a combination of basic and applied science, and is a great example of the university and MnDOT working together successfully to solve problems unique to our geography and climate,” said Jeff Marr, Associate Director, Engineering and Facilities, University of Minnesota St. Anthony Falls Laboratory.

What Was the Need?

Roadways in the Red River watershed are prone to flooding and overtopping, where wide flows of water wash across the surface of the roadway. Downstream scour and erosion of roadway embankments can result in breach or washout of the entire roadway. Repairing the damage caused by flooding and overtopping can be costly and time-consuming, requiring lengthy road closures. Frequent flood events in recent years reinforce the need to protect roadways where flooding is likely to occur.

Raising the roadway to prevent overtopping is not a feasible solution, as flood plain law does not allow moving the problem elsewhere by backing up the water. The most cost-effective option is to allow floodwaters to overtop roadways and to try to protect their embankments from scour. Protecting roads from destructive scour and erosion by developing cost-effective scour prevention measures could greatly reduce the cost of repairs, as well as the time required to reopen the roadway after a flood event.

What Was Our Goal?

The goal of this project was to investigate the effectiveness of slope protection techniques to shield overtopped roadways and their downstream embankments from scour and erosion. A further goal was to use cost-effective methods that could be installed by local agencies instead of contractors. The researchers evaluated several “soft” design methods using an integrated approach of full-scale models and field monitoring.

What Did We Do?

Using the findings from a literature review, the research team developed a field-based program to collect data on the hydraulics associated with full-scale overtopping events. Researchers recorded flood stage at several locations near the Red River during over-topping events and evaluated the failure modes under natural conditions. Annual field monitoring occurred from 2013 through 2016 during overtopping events.

Next, the research team conducted a series of experiments at a full-scale laboratory facility to study the hydraulic and erosional processes associated with overtopping. The facility simulated a transverse section of a roadway and included an upstream water supply, road crest, shoulder and downstream embankment slope.

Photo of sod growing through square mesh plastic geogrid material
Sod is overlaid with geogrid to help stabilize the sod’s root system and soil beneath.

Two slopes were examined in the lab: 4:1 (horizontal:vertical) and 6:1. With bare soil used as a control, three erosion protection techniques were investigated: armored sod hydraulic soil stabilization, turf reinforcement mat (Enkamat) and flexible concrete geogrid mat (Flexamat). All three are alternatives to riprap and other hardscapes, and encourage vegetation to grow through a mat, helping to stabilize the soil and protect the embankment from scour and erosion.

What Did We Learn?

The researchers were able to draw some definitive conclusions from the laboratory experiments:

  • Bare soil with no vegetative cover (the control) is highly susceptible to erosion and is the worst-case scenario. New installations should have established vegetation before the first overtopping event is expected.
  • All three mitigation techniques reduced erosion, but the flexible concrete geogrid mat provided the best protection. Researchers noted that these results describe overtopping that occurred immediately after the protection treatments were installed. Established vegetation and root growth would likely improve the performance of all techniques.
  • Initiation of erosion appears to be linked to small-scale inconsistencies in the soil, erosion control material and placement of the protection technique. Small failures can quickly develop into mass failure of the embankment.
  • Failure occurred in areas where the protection technique physically separated from the surface of the soil and exposed a direct pathway for the water to flow. Inflexible protection techniques were the poorest performers.
  • Common locations for failure were the toe of the slope and the upstream transition from the shoulder to the soil slope, with steeper slopes failing most often.

What’s Next?

No mature vegetation existed on the embankment slope in the laboratory flume, which mimics the post-construction period in the field. Full vegetation is more typical for much of an embankment’s life cycle. Since one of the most important functions of vegetation on a slope is the ability of its roots to anchor soil, further study of these techniques with mature vegetation could provide a better understanding of their effects.

Future studies should include other stabilization techniques as well as the effects of overtopping on frozen and thawing soils, through-embankment seepage or piping, and various soil types on performance of the stabilization technique. Future projects could also evaluate the use of multiple techniques along with the study of anchoring improvements and longevity of the erosion control products.


This post pertains to the LRRB-produced Report 2017-21, “Design Considerations for Embankment Protection During Road Overtopping Events,” published June 2017. NCHRP Synthesis Report 496, “Minimizing Roadway Embankment Damage from Flooding” provides the state of the practice on mitigating damage from overtopping. 

Minnesota's transportation research blog