Newly developed software has drastically reduced the amount of time and effort required by MnDOT’s Regional Transportation Management Center (RTMC) to analyze congestion in the Twin Cities metropolitan area.
Developing MnDOT’s annual Metropolitan Freeway System Congestion Report used to be a manual process that could be applied to only a portion of the large quantity of data generated by in-pavement sensors.
The new Highway Automated Reporting Tool now automatically imports and cleans data to produce a report about the percentage of network miles congested during peak periods as well as three new reports on other performance measures.
The tool will help MnDOT engineers and planners better develop congestion reduction strategies and determine the most cost-effective investments in the network.
From RTMC’s control room, engineers monitor and manage 400 miles of Twin Cities freeway traffic using data from thousands of in-pavement sensors.
“Before HART, it took months to analyze freeway performance using traffic data from only the month of October. Now engineers can quickly analyze data from any time period, significantly improving traffic planning,” said Jesse Larson, Assistant Freeway Operations Engineer for MnDOT’s Metro District Regional Transportation Management Center.
The tool was developed in a MnDOT-funded study led by University of Minnesota researcher John Hourdos.
Note: This article was adapted from the May–June 2014 issue of our Accelerator newsletter. Sign up for your free print or email subscription by clicking here.
While not inherently unsafe, MnDOT’s fracture-critical bridges — those having critical, nonredundant components — must be inspected on a regular basis. To help track the health of these bridges, MnDOT has developed a bridge health monitoring system that uses electronic instrumentation to provide advance warning of structural distress.
The system detects acoustic emissions — stress waves caused when cracks form and propagate in the steel components of a bridge. Researchers recently deployed and tested the system on the Cedar Avenue/Highway 77 Bridge in Burnsville, enabling them to develop procedures for automatically collecting and processing data.
“Ever since the collapse of the I-35W bridge in Minnesota, many states have been interested in developing a bridge health monitoring system that will help engineers address the many challenges of managing infrastructure and ensure the longevity and safety of our bridges,” said Moises Dimaculangan, MnDOT bridge rating engineer.
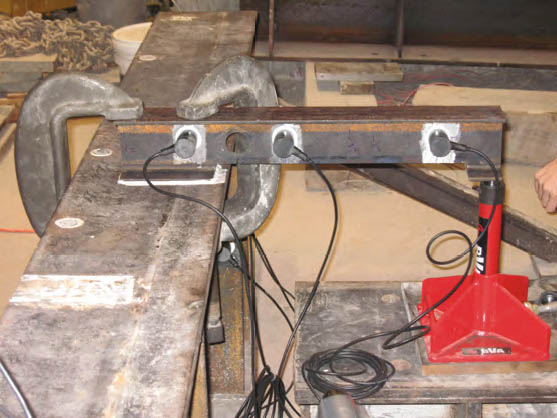
To help distinguish real monitoring events from false alarms, researchers conducted tests to capture acoustic emission data caused by brittle fractures in steel beams using the same bridge health monitoring system currently being used at the Cedar Avenue Bridge.
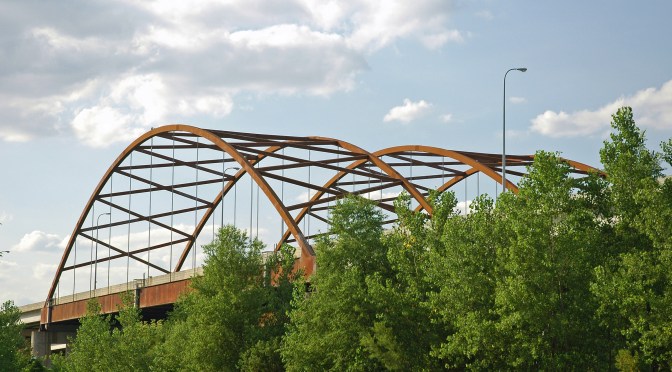
MnDOT will continue to use the system to monitor the Cedar Avenue Bridge, a steel tier-arched bridge over the Minnesota River. It was chosen because it is fracture-critical, but has no history of cracking. The test deployment also led to guidelines for monitoring other fracture-critical bridges.
University of Minnesota researchers recommend further investigation into acoustic emission data analysis methods, as well as using the system developed in this project to monitor another steel bridge, one with a history of cracking.
*Note: This article was adapted from the upcoming May–June 2014 issue of our Accelerator newsletter. Sign up today to receive your free print edition or to receive email notification when new issues become available online. Subscribe here.
Putting GPS units on MnDOT highway mowers is expected to speed mowing operations and cut herbicide usage by 50-percent in metro area ditches, reducing groundwater contamination.
MnDOT’s Metro District highway maintenance division will be one of the first — if not the first — state agencies in the country to equip the majority of its maintenance tractors with Automated Vehicle Location systems.
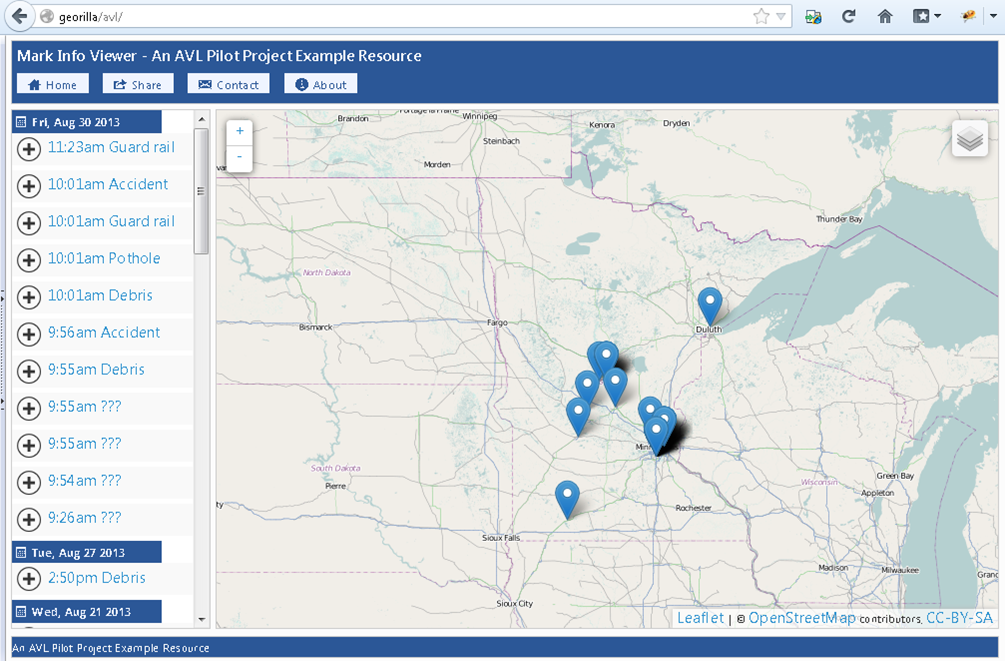
Not only will crews be able to effortlessly track their progress — reducing paperwork and freeing time for other maintenance activities — but the AVL’s live mapping software will help them avoid noxious weed patches, thereby reducing their spread.
Last year, MnDOT tested the GPS software on five mowers.
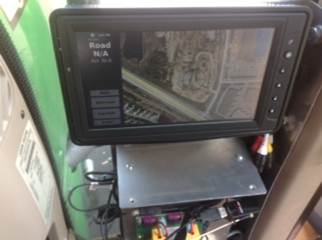
“AVL alone enables the tracking of vehicle positions, but when combined with equipment sensors and an on-board monitor with user interface, it becomes a very innovative way to reduce operation costs,” said MnDOT Project Engineer Trisha Stefanski, who applied for funding from MnDOT’s Transportation Research Innovation Group for the pilot project.
Vehicle tracking systems have been shown to reduce chemical usage by crop farmers, improve route efficiencies in truck driving and help cities and counties track snowplows.
The on-screen mapping shows the location of weed patches, so mowers can avoid them, reducing their spread.
MnDOT Metro, which tested five AVL units last year, hopes to equip as much of its remaining fleet as possible.
In the grant application, Stefanski estimated the technology will pay for itself in about a year’s time, largely due to herbicide savings.
Noxious weeds
MnDOT is required by law to manage certain noxious weeds along its highways. Each year, weed inspectors survey one-quarter of metro ditches for weeds, which enables them to concentrate eradication efforts on the worst areas.
Touch-screen maps will contain the noxious weed locations so operators can see weed patches and mow around them.
Herbicide usage is estimated to drop an estimated $100,000 to $150,000 per year. (This estimate was based on the original funding request. Final numbers haven’t been released.)
Operators can use the on-screen map to mark the location of new patches of noxious weeds.
Noxious weeds like Wild Parsnip — which can cause painful skin boils — might even be eradicated, reducing the risk for field crews, such as construction workers and Adopt a Highway volunteers.
Until now, maintenance crews have relied on paper maps to identify weed locations, which is less effective.
“What’s better, looking at a live screen when you’re going down the road and seeing where weeds are coming up, or trying to refer to a piece of paper?” Stefanski said.
Other advantages
The AVL equipment will also allow for automated reporting.
Mower operators can use the on-board AVL monitor to mark the location of guardrail hits, potholes, washed-out culverts, debris and unmarked noxious weeds.
Operators can electronically mark the location of guardrails, debris, potholes and more.
Currently, operators must track their activities using hand-written forms or spreadsheets in the office.
The AVL system will also automatically track their location history, allowing operators to optimize their routes based on how long it took to mow segments in the past.
It will also be easier to answer questions from the public, who want to know the last time a certain ditch was mowed.
“Making everything geographically located adds so much analysis opportunity,” Stefanski said.
MnDOT also has AVL technology on an herbicide applicator to better track where it’s sprayed. Other future potential applications including pothole patching and road sweeping operations, Stefanski said.
In an effort to encourage more use of safety rest areas and reduce drowsy driving, the Minnesota Department of Transportation is bolstering amenities and plans to install new signage at select rest areas across the state.
Drowsy driving is conservatively estimated to cause at least 1,550 deaths nationwide each year and $12.5 billion in monetary damage.
Motorists would stop more frequently at rest areas if they knew what rest areas offered, according to market research completed in 2009.
MnDOT will design and install highway symbol signs to advertise the amenities at 13 rest areas in a pilot project funded by MnDOT’s Transportation Research Implementation Group.
“We are using this as a way to entice drivers to take a break, pull over and refresh before returning to the road,” said Robert Williams, MnDOT Safety Rest Area Program Manager and the project proponent.
Rest areas in Brainerd and Cass Lake, Minn., can now offer a tourism-related gift shop, thanks to a change in law.
Amenities differ greatly between rest areas within the state, as well as across the country; this depends on when they were built and whether they are located on an interstate, state highway or toll road.
Older, smaller rest areas may only have a bathroom and picnic area, while newer facilities often have features such as children’s play areas, staffed travel counters and dog runs.
In the future, the state may consider new amenities such as gift shops, adult exercise equipment to rejuvenate motorists, electrical vehicle charging stations and perhaps even electrification stations to allow truck drivers to power their TV or refrigerator without idling their vehicle.
Research has found that as the spacing of rest areas increases beyond 30 miles, the number of drowsy driving crashes goes up exponentially, Williams said.
Each sign will advertise up to six amenities.
Proposed Signage
Symbols on each sign will identify up to six amenities, such as in the example above, which depicts an assisted restroom, gift shop, ticket sales, EV charging stations, childrens’ playlot and adult exercise equipment.
MnDOT will evaluate the pilot project to determine if the symbol signs are effective in communicating to travelers the amenities offered at individual rest areas and if the signs were a factor that encouraged them to stop.
If the two-year project goes well, the state may add similar signs to the remaining 39 Class I safety rest areas (those rest areas equipped with flush toilets).
Some of the signs will require a request to FHWA for experimentation. The intent is to install the signs in the summer of 2015 at rest areas on northbound I-35, eastbound I-94, as well as at the Brainerd Lakes Area Welcome Center on Hwy. 371.
Rest Area Offerings Increase
Although travelers and state DOTs would often like to introduce new amenities, state and federal laws limit what states can offer.
Toll roads and highways built before 1960 (the Interstate era), mostly in the East Coast or Chicago area, have fewer federal restrictions than rest areas in Minnesota and may feature restaurants or convenience stores.
Changes to Minnesota state law in 2005 and recent changes to federal law in MAP-21 now allow limited commercial activities, such as tourism-related gift shops and ticket sales at rest areas. MnDOT and its partners have taken advantage of some of these changes at its visitor centers in Brainerd/Baxter and Cass Lake.
In addition, the state is exploring the concept of using rest areas as transit transfer facilities, where long-distance bus carriers and regional transit lines can exchange passengers.
These transit hubs would shorten travel times for long-distance travelers and allow the rest areas to serve multiple functions while providing a comfortable waiting area for passengers.
(Feature image courtesy Michael McCarthy, Center for Transportation Studies.)
Earlier this year, we wrote about the Minnesota Bicycle and Pedestrian Counting Initiative, a project that developed guidelines and protocols to help transportation planners accurately count non-motorized traffic. This groundbreaking research involved a diverse partnership of state and local officials, University of Minnesota faculty, and private and nonprofit organizations.
On Wednesday, April 23, the project team (photo above) was honored with an award from the Center for Transportation Studies. Team members accepted the CTS Research Partnership Award in a ceremony at the McNamara Alumni Center in Minneapolis. The award is given each year to projects that have resulted in “significant impacts on transportation” and that draw on “the strengths of their diverse partnerships” to achieve their results.
The video below, produced by CTS, explains the importance of the project. MnDOT is now in the process of implementing the research results by installing permanent counters and using portable counters in select locations around the state. MnDOT plans to use the information for a variety of purposes, including planning, safety analysis, investment planning and quality-of-life analysis.
A new technology that uses 3D-imaging sonar will enable MnDOT engineers to visualize the substructure of a bridge in a way they never have before.
Until now, MnDOT has relied on human divers and depth finders to identify problems beneath the water.
Divers are limited by what they can see and feel in murky waters, however, and depth finders can only look down, not around.
“With this new technology, we will be able to provide high resolution three-dimensional images of underwater areas, structures and objects to show what is occurring, regardless of water clarity,” said MnDOT Bridge Waterway Engineer Petra DeWall, who has received funding from MnDOT’s Transportation Research Innovation Group to purchase the equipment.
Video imagery from a sonar inspection of Minneapolis’ Third Avenue bridge is above.
Currently, MnDOT hires engineer divers to physically inspect about 500 bridges every five years. They look for cracked concrete, exposed reinforcement and other detrimental conditions.
Although divers can spot issues, they can’t always thoroughly assess the scope of a problem, such as the amount of sediment being washed out around a bridge pier, a problem called bridge scour.
It can also be difficult — or dangerous — for divers to venture down for an inspection.
This was the situation last winter with the Third Avenue Bridge in downtown Minneapolis, where the streambed has degraded around a bridge pier, causing erosion to the pier.
“The Third Avenue inspection was not totally detailed. We knew there was a void under the bridge, but it was very hard to visualize,” DeWall said.
Early ice build-up halted further inspection in November, so MnDOT asked 3D sonar scanner manufacturer Teledyne BlueView to scan the area as a demonstration of its equipment.
A video of the inspection is below:
Multiple holes were cut in the ice sheet to deploy the sonar, which provided an image of the bridge scour by emitting sound-waves that created a point cloud.
“It gives you a large data set of where the sound reaches and comes back to the equipment,” DeWall explained.
The 3D image provides a level of detail that will enable repair and construction contractors to make more accurate bids, saving MnDOT money on projects.
Although dive inspectors are also beginning to invest in this new technology, MnDOT wants its own equipment to perform quick assessments of troublesome spots without going through the lengthy contracting process.
The Federal Highway Administration is conducting a pooled fund study to see if the technology eliminates the need for dive inspectors all-together.
MnDOT also plans to use its 3D scanning sonar to inspect repair projects and assess bridge construction.
One of DeWall’s first goals is to take a scan of the Hastings bridge after construction is complete, which will provide a baseline scan that can be compared against future inspections. The old bridge has had problems with the loss of rocks at its piers. It is unclear if the rock just sinks or is washed away downstream. Monitoring will let MnDOT see what is happening over time.
“Inspection is just one part of it,” DeWall said of the sonar equipment. “The big interest in this project is coming from our construction folks.”
Post-Construction
Imagine building a new house and not being able to complete the final walk-through.
This is the situation that transportation departments face when they build a new bridge, due to the limitations of underwater inspections.
“With 3D technology, you can go back afterward and check to make sure things were done the way they were supposed to,” DeWall said.
DeWall wishes the state had the scanner many years ago when a bridge was built that required expensive correction.
A bridge construction crew left construction material behind under the water, which wasn’t discovered until the redirected water flow caused significant erosion to the bridge pier.
Divers picked up that something was going on during a routine inspection, but engineers still had to bring in depth finders to get a better look. Due to the water current, they were limited in how close they could get to the bridge pier, and turbulence crashed their boat against the pier, damaging the transducer.
Not only would this 3D technology have provided a more thorough assessment than the depth finder, it also could have captured the imagery from a safe distance away.
Flooding in the Red River Valley is an almost annual occurrence, and the cost to roads, property and lives is huge.
Highway 1 gets torn up year after year, only to be rebuilt in time for next year’s flood, joke residents in the little town of Oslo, which becomes an island whenever the roads close.
While not much can be done to prevent swollen farm fields from overflowing, what if a road embankment itself could be bolstered to prevent physical damage to the underlying structure of the road?
“We can’t just raise the road because it would create backwater upstream,” explained JT Anderson, Assistant District 2 Engineer. “Our best bet is to let the water over-top the road and try to protect the road when it does.”
Researchers have built a flume inside the University of Minnesota’s St. Anthony Falls Laboratory to test six methods of embankment protection specific to the needs of towns like Oslo.
“It is not uncommon for one over-topping site to have a half-mile long stretch of road being damaged,” said university research engineer Craig Taylor. “One road being protected should cover the cost of the study and the cost of deploying the erosion control product for that road.”
Nationally, research of this kind has mostly been restricted to high-intensity flooding.
“Those really high-depth, short duration events, you can only protect an embankment with concrete and boulders,” Taylor said. “With longer duration, low-depth floods, we may be able to protect roads with soft armoring, like reinforced vegetation.”
The damage in northern Minnesota has been the worst on east-west roads, where the river flow runs perpendicular to the center of the road, causing the road to act like a dam and the water to jump at the edges.
“It eventually eats through that road embankment and makes the road collapse,” Anderson explained.
Researchers will examine how a cross-section of a road holds up under various erosion control methods at different levels and speeds of water-flow.
The damage from flooding was less in 2010 after engineers added rocks to the side of Highway 9, near Ada, Minn.
One test will be to slow the flow of water by covering the road shoulder with a rubberized membrane and temporary water-filled tubes.
Permanent schemes — such as turf reinforcement mats and rocks — will also be tested.
“These methods have been deployed in the field, but you never really know under which conditions they survived or failed,” Taylor said.
In the Red River Valley, MnDOT engineers have tried a combination of vegetation and boulders, as well as concrete blocks covered with topsoil, to protect highways. Flattening a slope is another option.
“I expect that a single erosion protection technique will not cover every situation our road embankments may be exposed to at any given location,” Anderson said. “Rather, I expect we would look at using several different techniques in concert to develop an effective erosion protection system for the expected velocities.”
Those who use the roads in Minnesota are generally those who pay for them — through gasoline and vehicle taxes.
But motorists aren’t the only ones who benefit when a new interchange is built or a highway is improved. Home and business values along the corridor go up and the price of undeveloped land can skyrocket.
With highway funds strapped, a new method of funding road expansion, called “real estate value capture,” is garnering attention.
This emerging technique strives to identify beneficiaries of transportation improvements beyond just the highway user, so they provide their fair share of the costs — a concept not dissimilar from residential street assessment.
For instance, a local government might dedicate the additional property tax revenue generated due to a new highway to offset some construction costs, or collect fees on land that is developed near an interchange.
However, value capture is a relatively new technique that has been used primarily for transit projects. To be considered for roads or bridges, questions need to be addressed about potential revenue, impacts and public acceptability.
In a new case study, researchers use a long-delayed planned extension of Highway 610 in Maple Grove to model the impact of a completed highway on nearby property values, and, for the first time, quantify the potential revenues from several value capture strategies.
With properties near new highway exits worth an additional $65,450 more per acre, researchers calculated that $37.1 million in revenue could be generated through assessments on existing development and impact fees for future development.
Other strategies explored include tax-increment financing and private-public development of undeveloped parcels, in which revenue generated by that development is split.
“This research demonstrates a way to estimate the value of transportation improvement and to communicate that to the public,” said principal investigator Jerry Zhao, an associate professor of public administration at the University of Minnesota’s Humphrey School of Public Affairs.
This map projects the anticipated increase in estimated market value (EMV Change) of parcels near Highway 610 that will result from completion of the highway and construction of exits at the two locations marked in purple. The impacted parcels are currently vacant, farmland or residential.
Study links:
Real Estate Value Capture: An Emerging Strategy to Pay for New Transportation Infrastructure – Technical Summary (PDF, 1 MB, 2 pages); Final Report (PDF, 5 MB, 36 pages).