Aging roads and bridges, increased traffic and persistently constrained revenues put local road systems in peril, but the public is largely unaware of the pressures facing their communities, a Minnesota Local Road Research Board study has found.
The LRRB undertook the study to identify critical gaps in public knowledge about local road system challenges and to develop communication methods and tools to address these shortfalls.
Researchers found that even elected officials are unaware of the gap in funding needed to keep the road system going — in part because county engineers have been creative in a period of dwindling resources, and the cost of deferred maintenance has not been immediately visible.
In fact, only one Minnesota news outlet specifically covered the issue of local road system sustainability in a five-year period analyzed by researchers, with media coverage focused mainly on big events, like the collapse of the 35W bridge and the federal transportation funding bill.
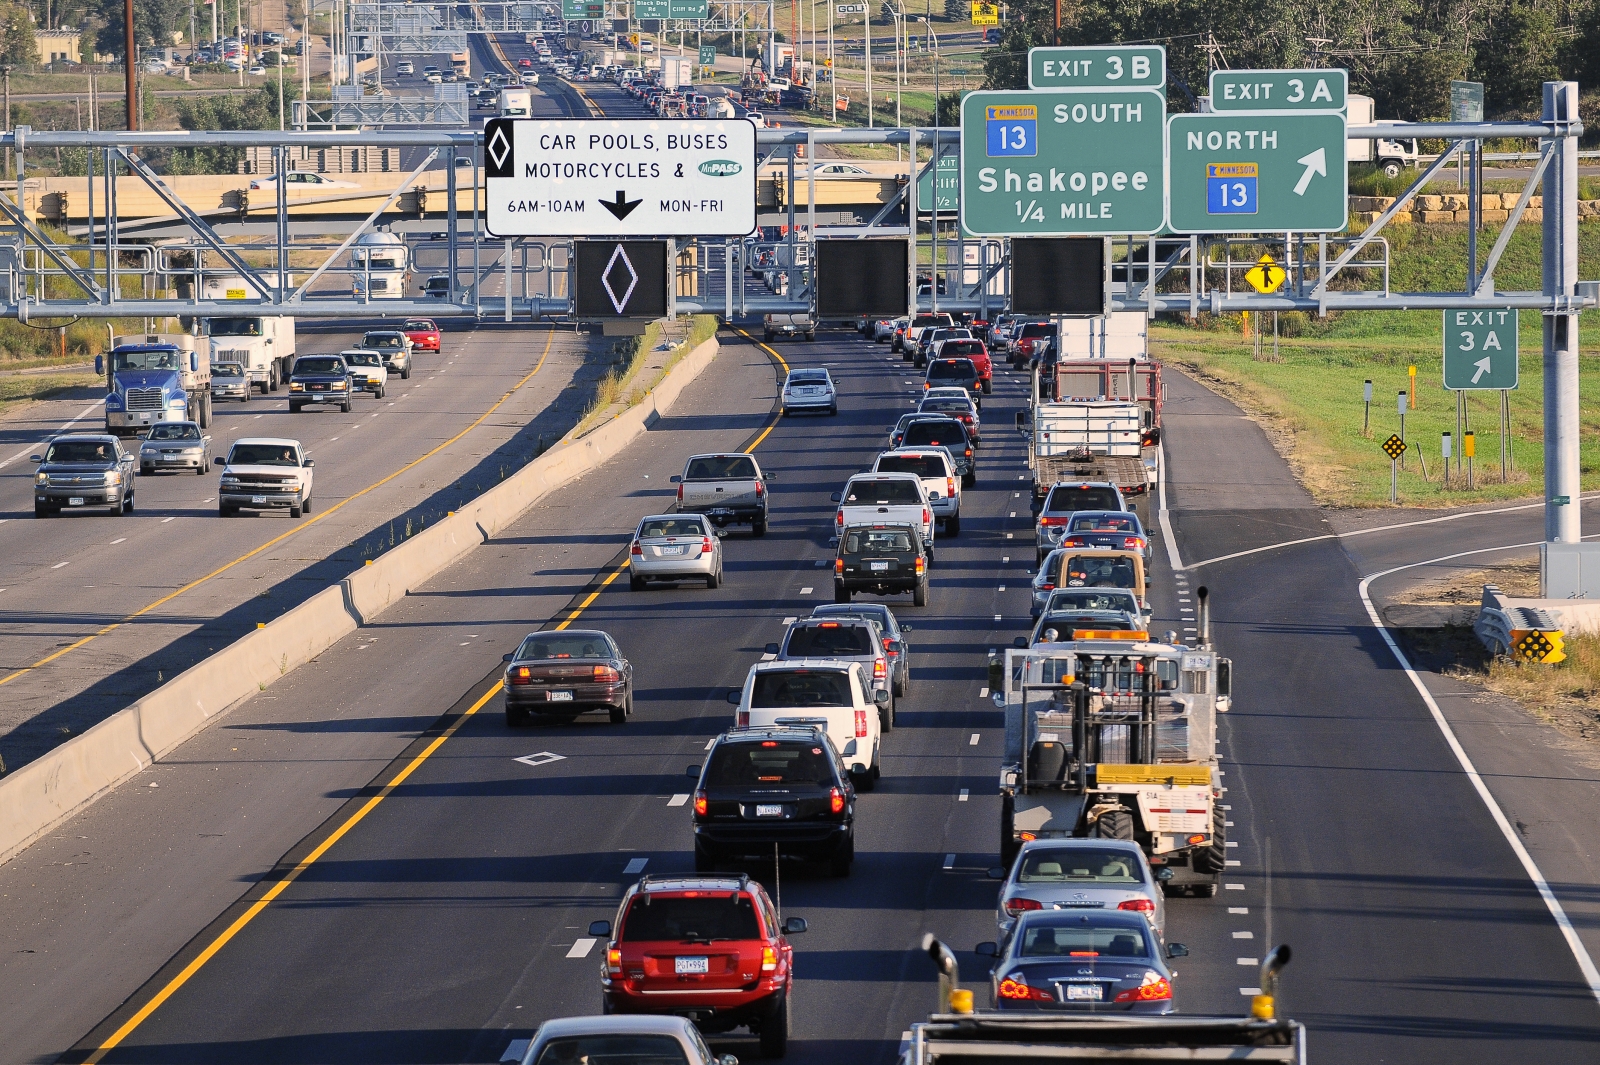
There are multiple challenges to road system sustainability, including rising construction costs, declining tax revenues, heavier agricultural and industrial equipment and rising public expectations.
Education needed
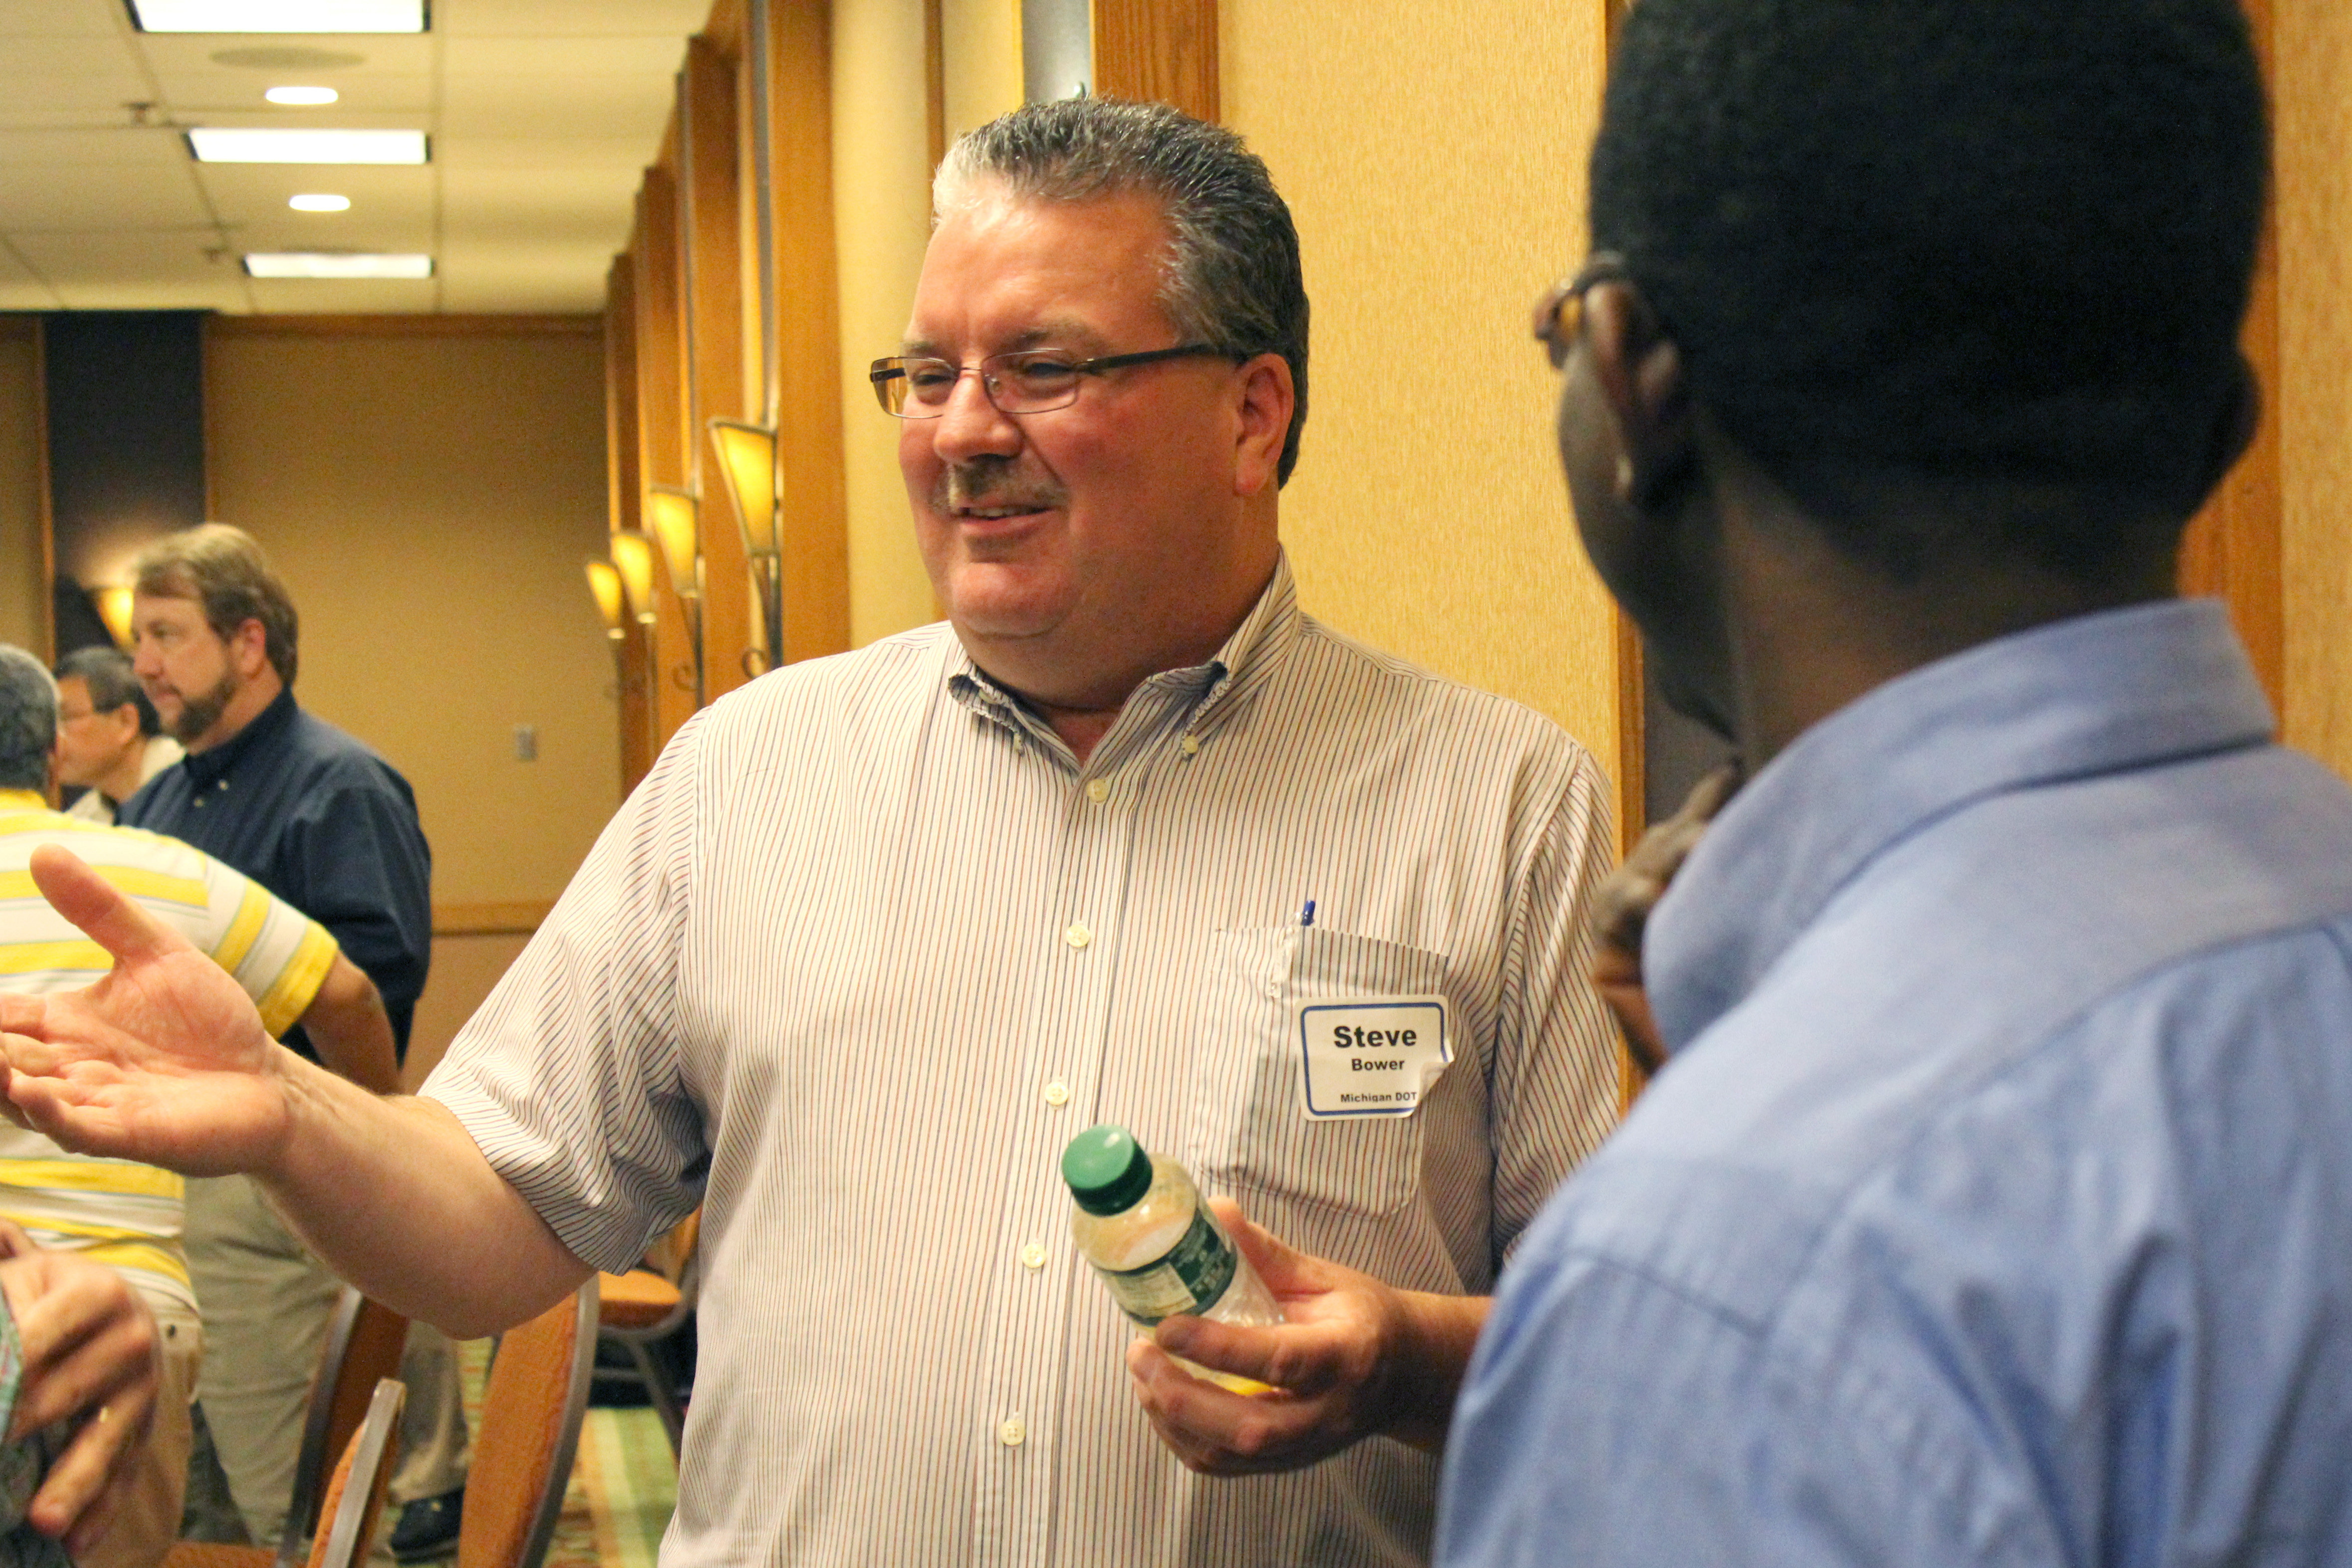
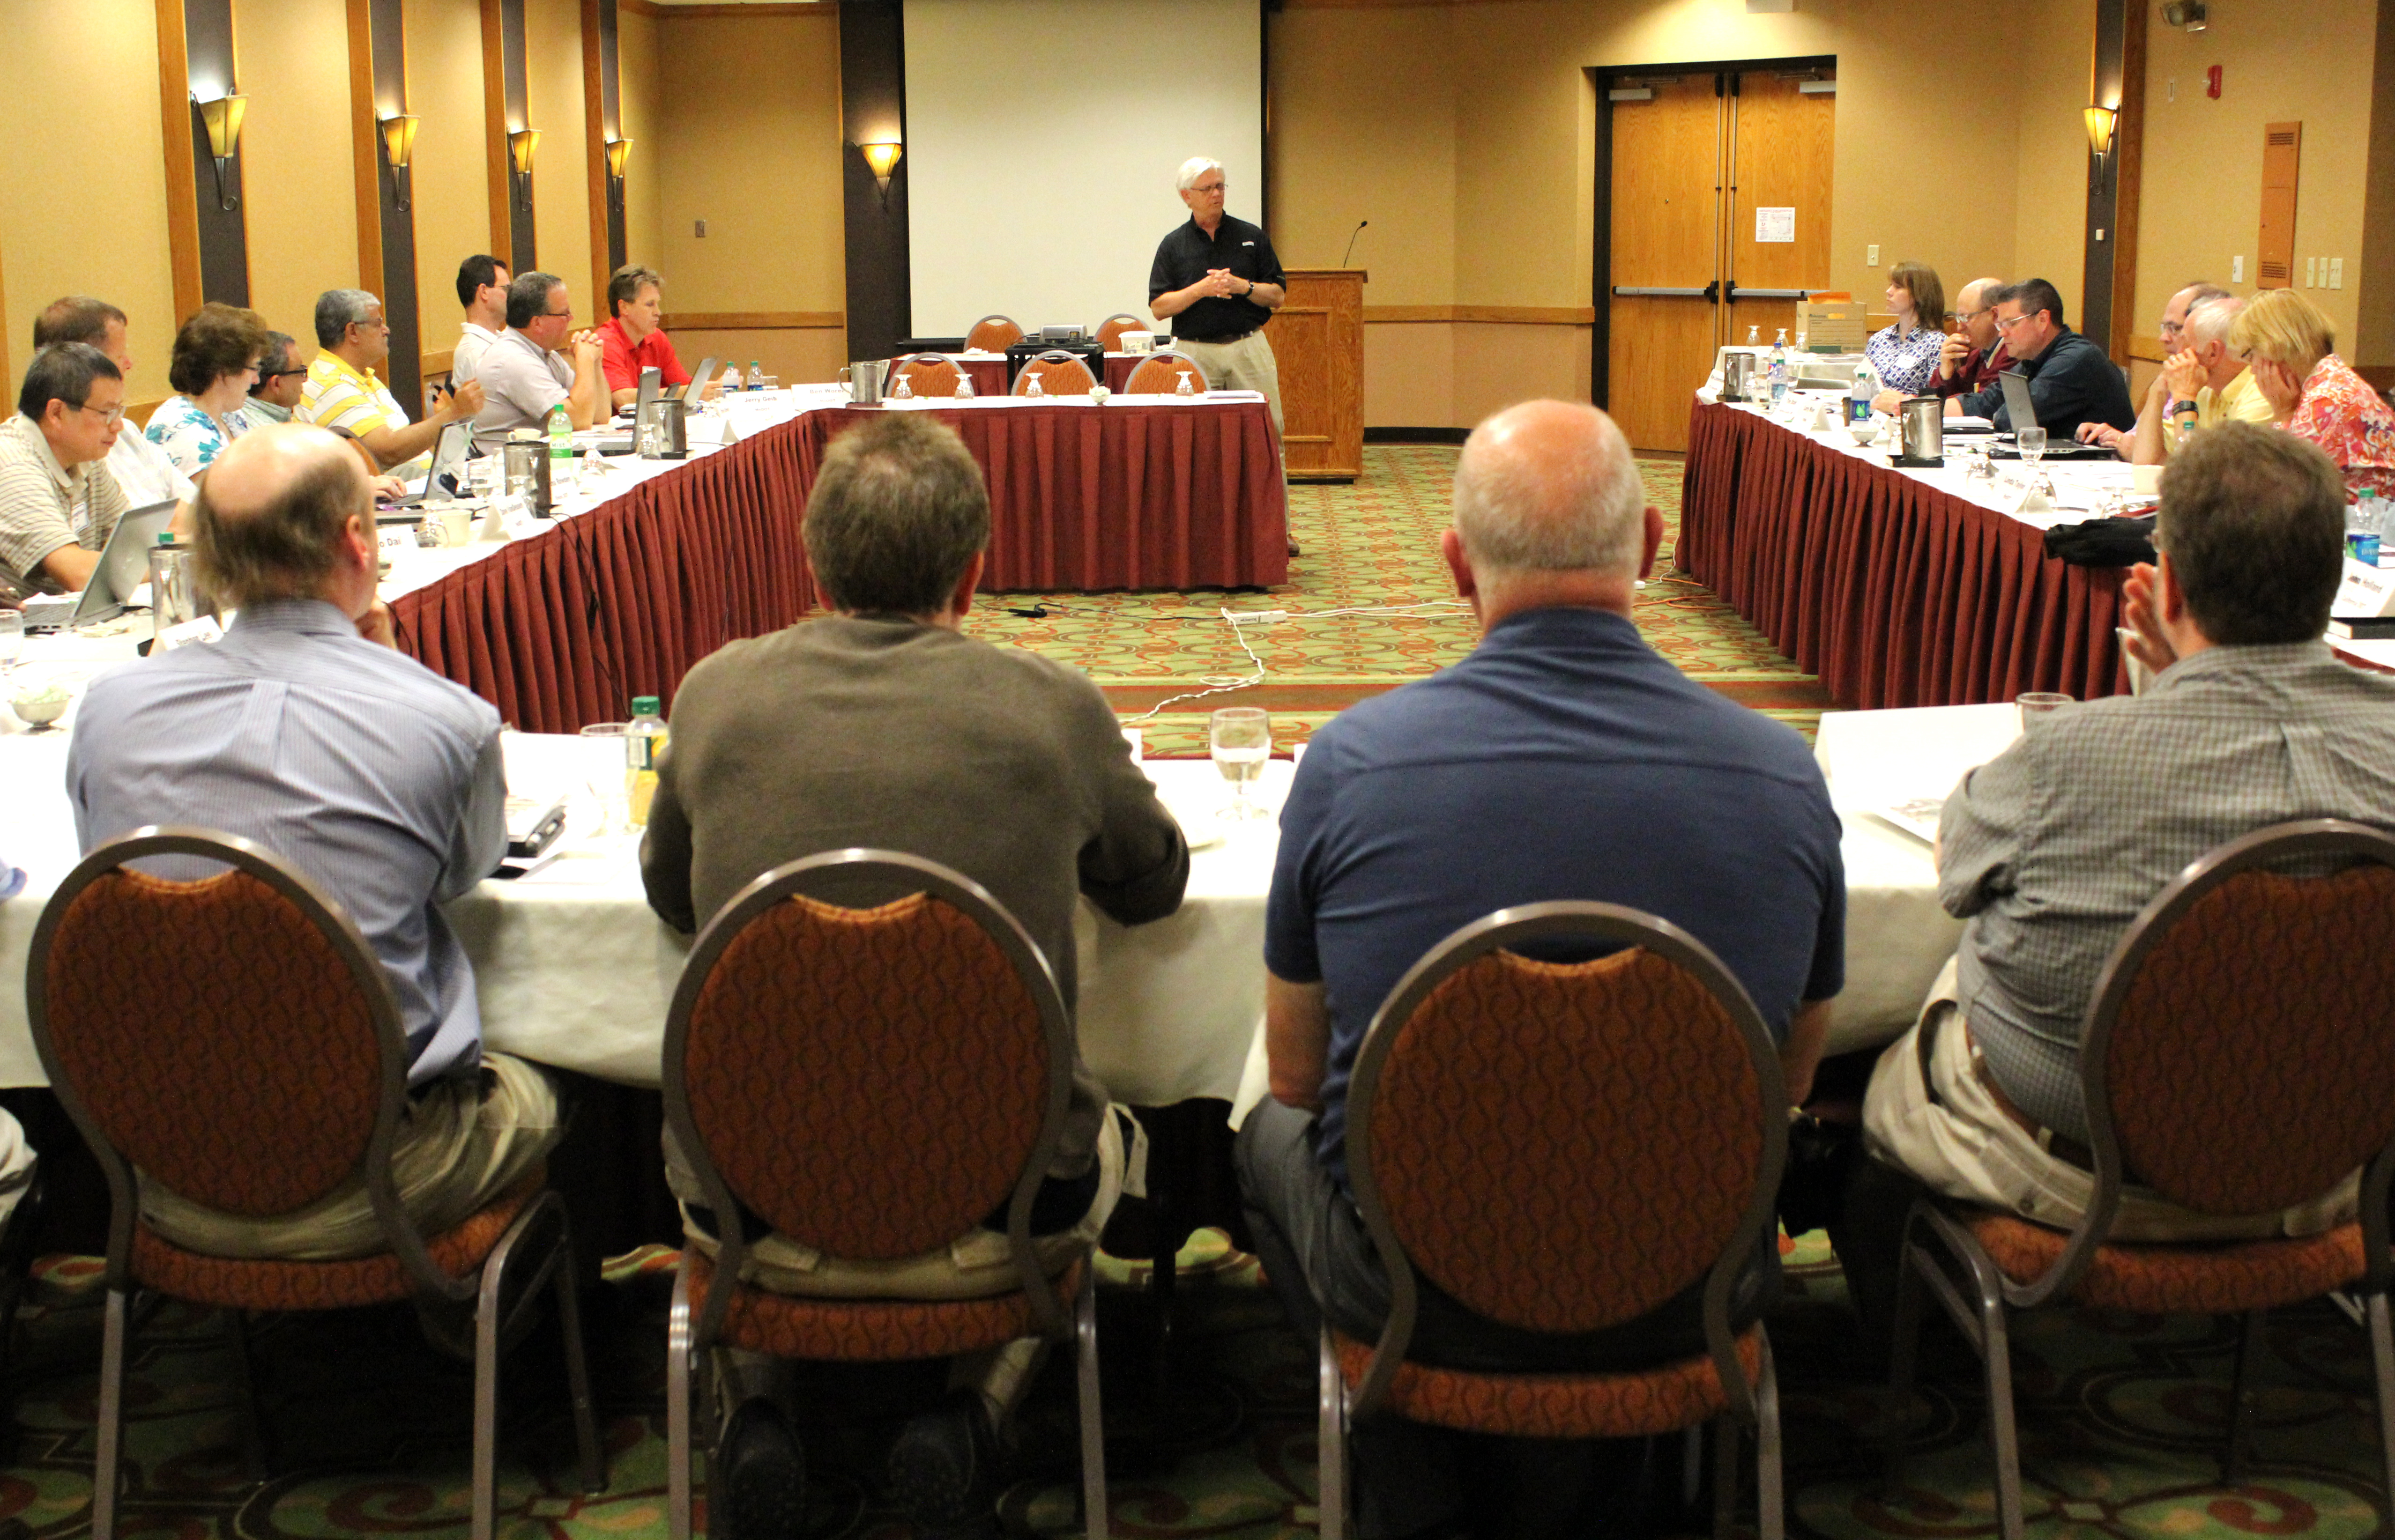
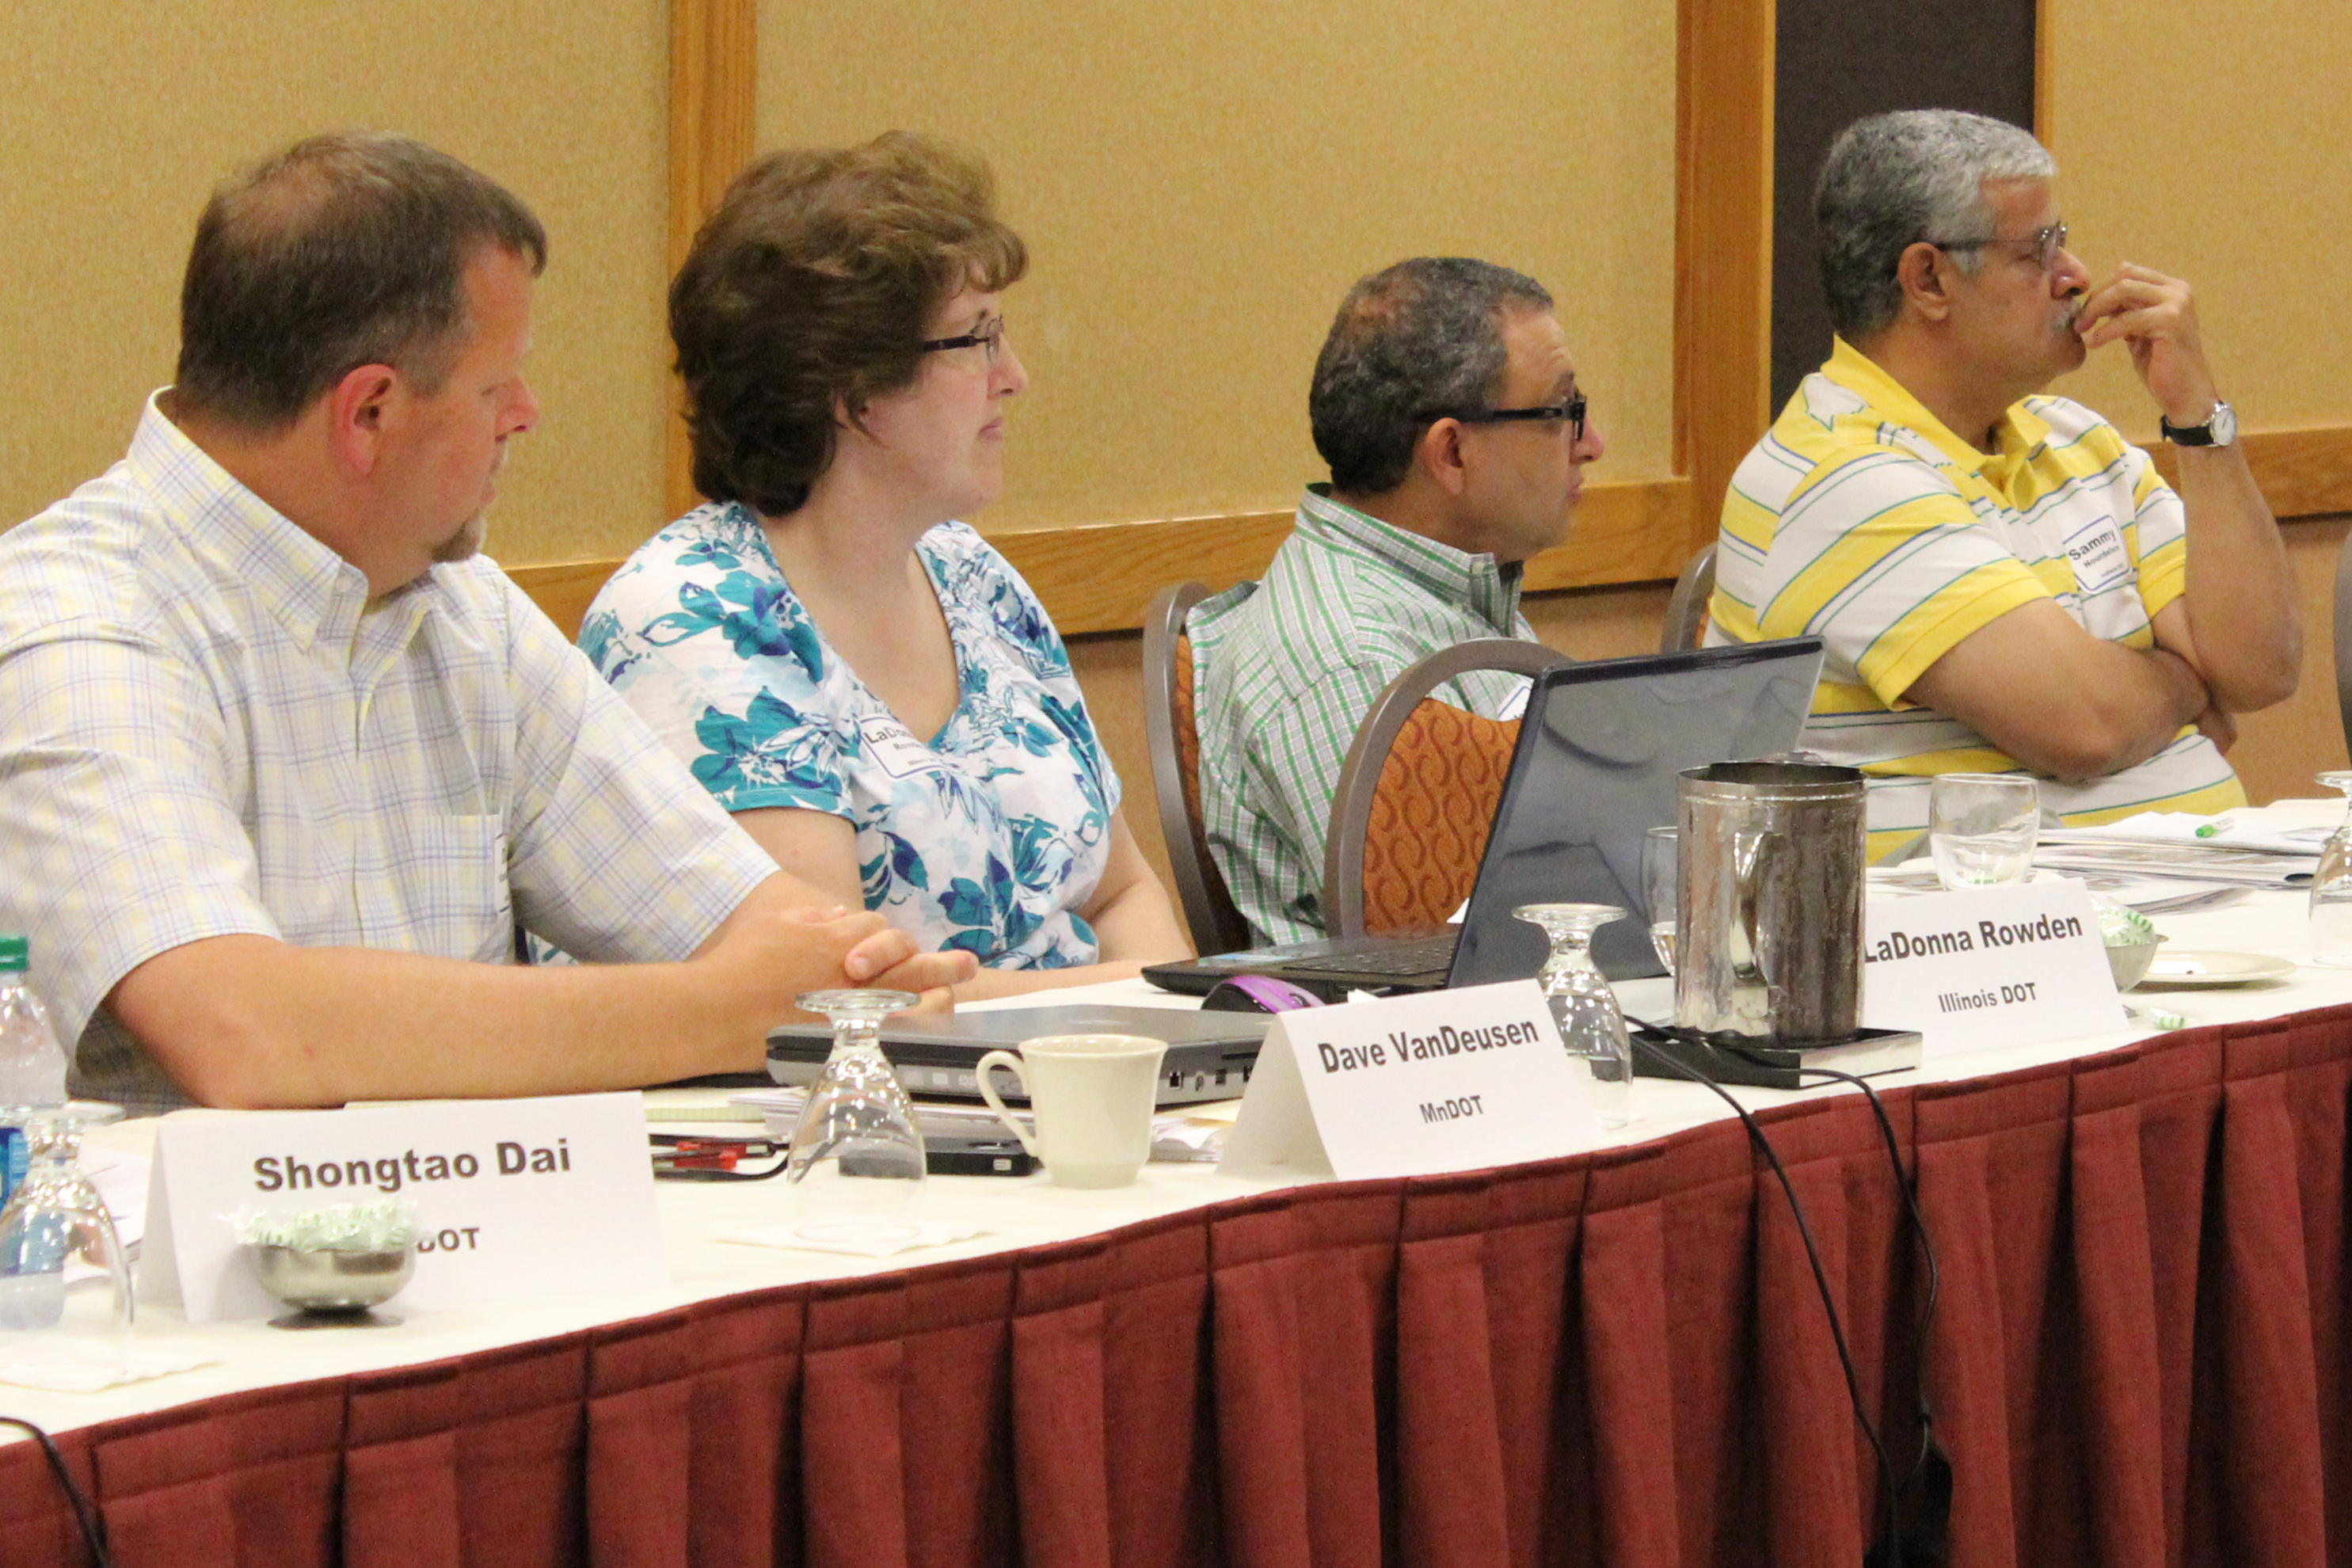
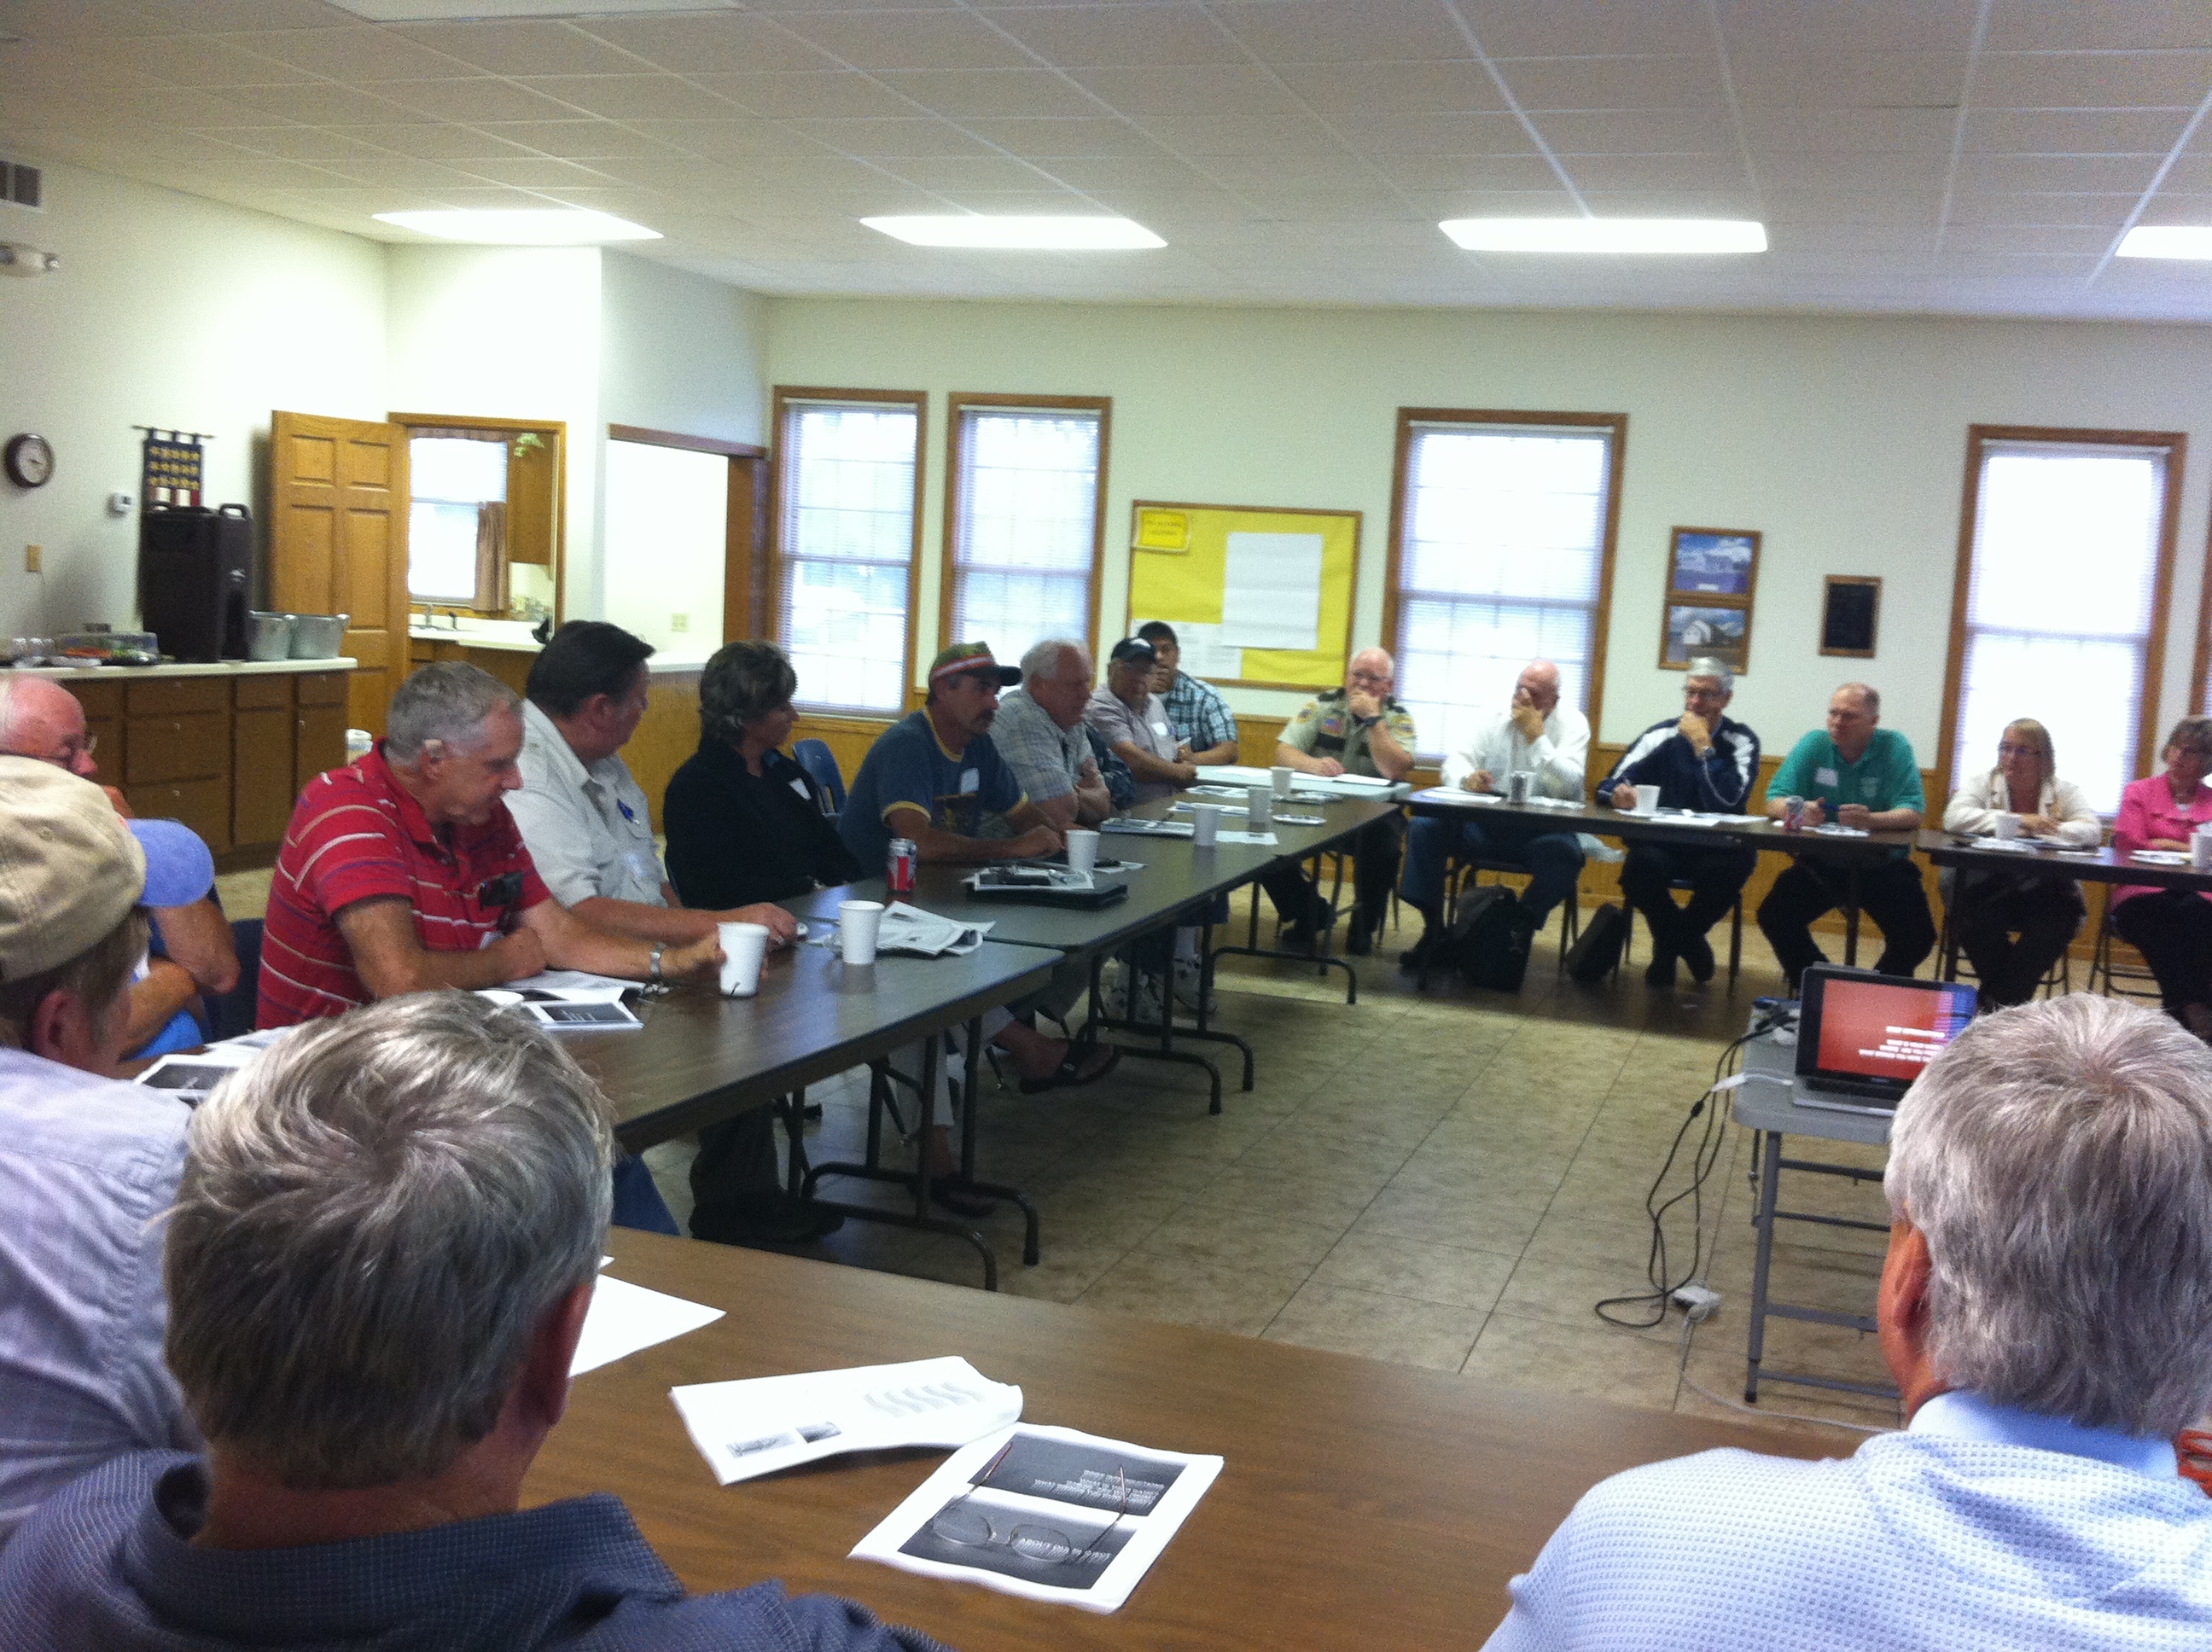
To help county engineers better educate the public, researchers looked at outreach strategies (such as open houses and focus groups) currently used in three Minnesota counties: Beltrami, Dakota and Jackson. The research team talked with county road managers to identify key issues and concerns and surveyed 91 residents who had participated in public engagement efforts.
The project revealed widespread confusion about local road system issues. For example, many participants erroneously believed that the gas tax covers (or was enacted to cover) the cost of maintaining local roads.
Researchers have produced a set of recommendations and tools for county engineers to use in designing effective public engagement processes that overcome confusion and a lack of information. A newly approved follow-up project will test the tools in three or four other Minnesota counties and cities.
Note: This article was adapted from the July-August 2014 issue of our Accelerator newsletter. Sign up for your free print or email subscription by clicking here.
Resources
- Technical Summary (PDF, 1 MB, 2 pages)
- Final Report (PDF, 8 MB, 91 pages)