All posts by Shannon Fiecke

Marketing and Communications Manager, MnDOT Research Services

What’s the life of a sign?

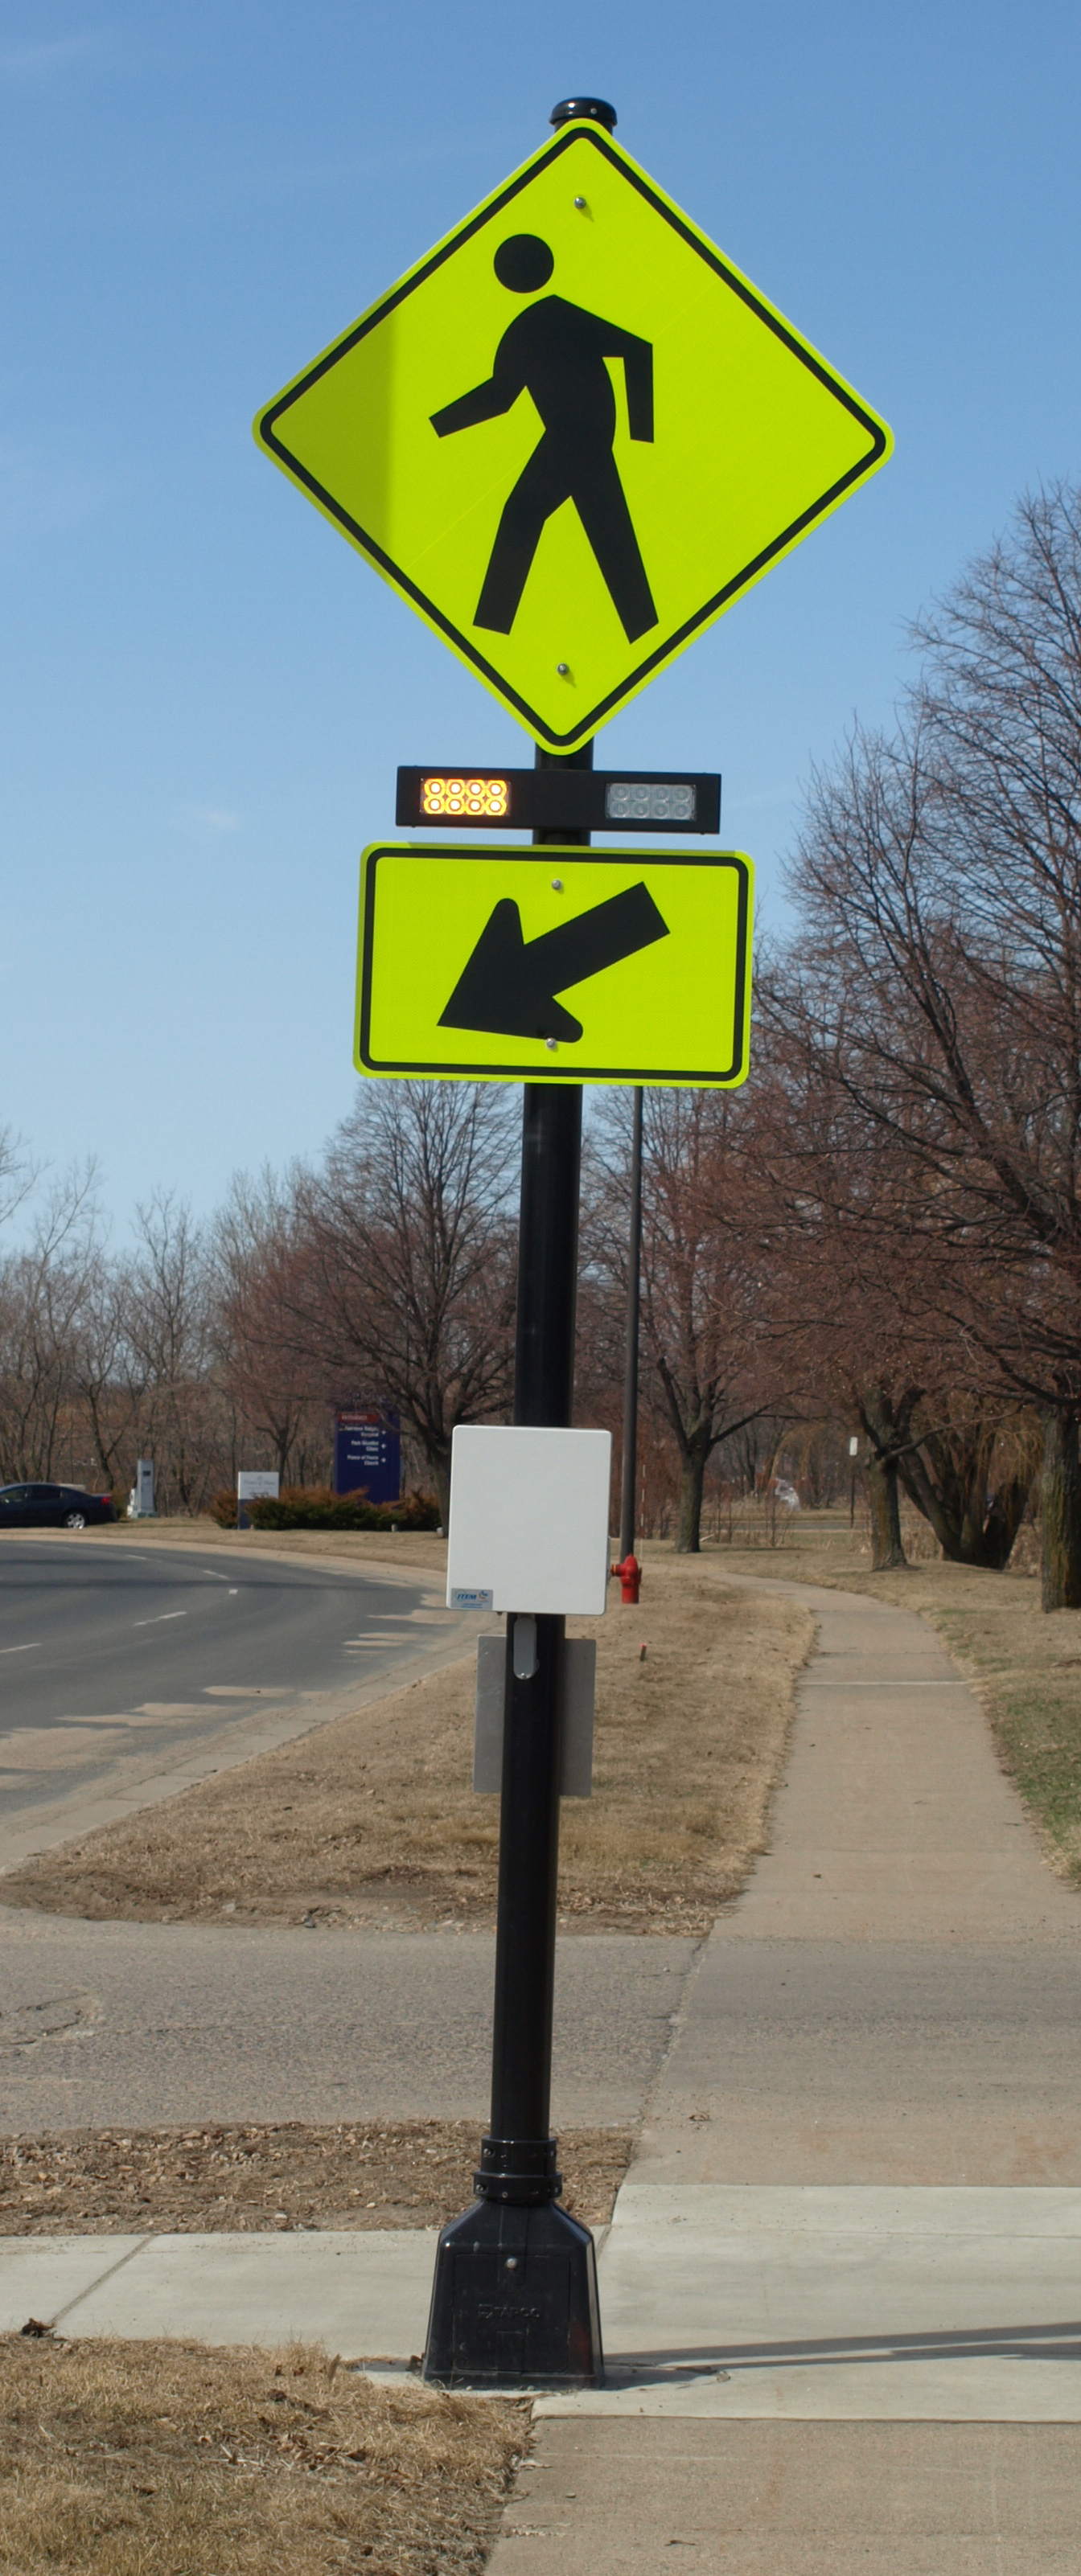
Traffic signs provide important information to drivers, and are a critical component of traffic safety. In order to be effective, their visibility and readability must be maintained under both day and night conditions.

Key to signs’ effectiveness is a quality known as retroreflectivity — the ability for signs to bounce light back toward a driver’s eyes, making them appear brighter and easier to read.  Retroreflectivity deteriorates with time, so transportation agencies need to actively maintain their signs.

A research project funded by the Local Road Research Board is developing a guide to help cities and counties better manage their signs, and also to meet a new Federal Highway Administration retroreflectivity management requirement while getting the lowest life-cycle costs.

Cities and counties have until June to establish a sign assessment or management method that will maintain minimum levels of sign retroreflectivity.

“Right now there’s a mixture of different management methods, with very little guidance as to what’s appropriate for your agency based on the signs you have and your labor force and equipment,” said Matt Lebens, a MnDOT research project engineer.

Since 1993, the Manual on Uniform Traffic Control Devices has included guidelines for minimum retroreflectivity of pavement markings and signs. The standards are meant to ensure that drivers, especially the growing population of elderly drivers, are able to detect, comprehend and react to traffic signs. The LRRB project is designed to help fill certain knowledge gaps in this area.

Measuring retroreflectivity

Possible methods for ensuring retroflectivity include night-time inspection; use of a reflectometer; spot-checking a sampling of signs that are the same age; or blanket replacement of signs once they reach a certain age.

Although the retroreflectivity of a sign is  guaranteed by its manufacturer to last a certain number of years, it commonly lasts much longer.

“Currently, we don’t have expected sign life guidance for agencies to use. Through this project, we are establishing a control deck for sign sheeting used in the state, and an expert panel will make recommendations on expected sign life ranges,” Lebens said.

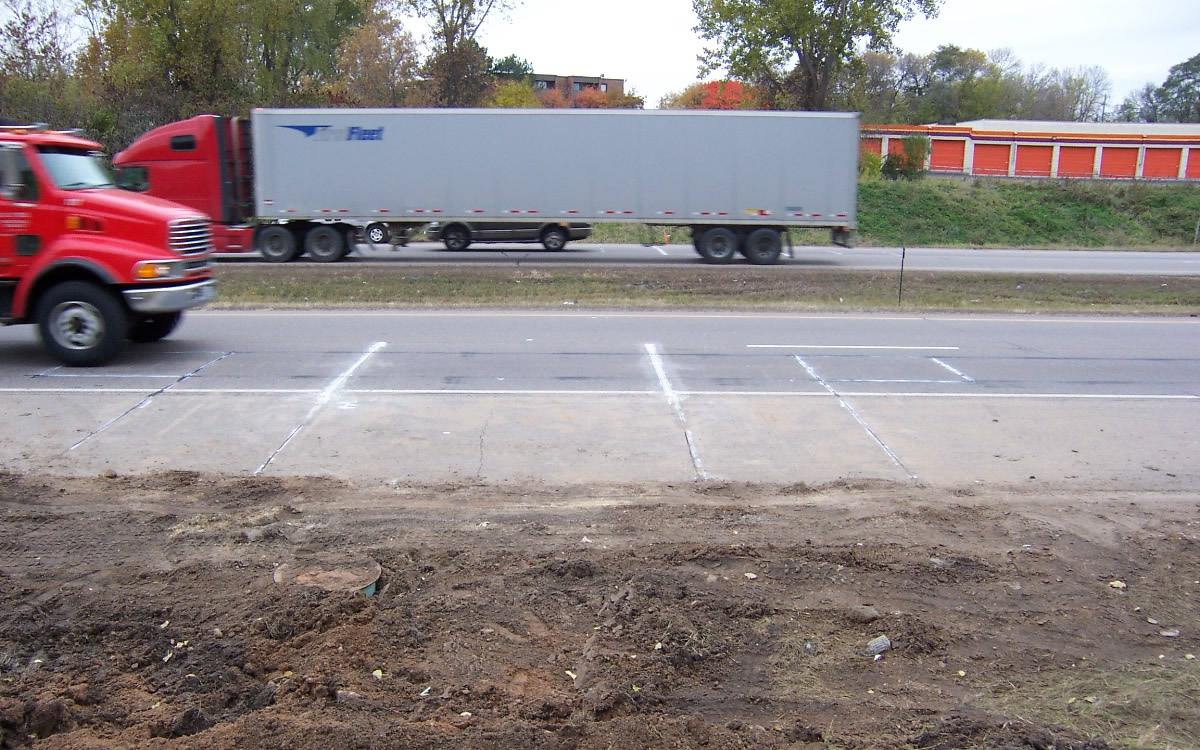
Researchers reviewed retro-reflectivity studies from other states and also measured the retro-reflectivity of signs out in the field across Minnesota using a retroreflectometer. As part of this project, MnDOT is providing training on the retroreflectometer and will also make it available for loan to local municipalities. (Watch a video demonstration.)

At MnDOT’s MnROAD site,  control decks contain dozens of signs. In addition to measuring retroreflectivity, the MnDOT Materials lab is monitoring color fade, which has been a larger issue in Minnesota.

“By getting better data as to the real life in-field life span of the signs, agencies will have a more realistic and better informed value for sign life expectancy, as well as potentially reducing costs,” said MnDOT Senior Engineer Mark Vizecky.

Expected life

There’s been no definitive studies to date as to what the life of a sign is, said lead project investigator Howard Preston of CH2M Hill, but the research so far shows it is in well excess of manufacturer warranties.

Cities and counties will be advised to pick an expected sign life that goes beyond the warranty – and then stay tuned.

“The notion is to watch these signs until they fail,” Preston said. “The sheeting material is better than it used to be. The failure might be 20 or 30 years out.”

There are two basic types of reflective sheeting material: beaded and prismatic.

Although beaded is guaranteed to last 10 years, researchers anticipate a retroreflectivity life of between 12 and 20 years old.

For the prismatic material – which has a 12-year warranty – the life cycle is anticipated to be 20 to 30 years.

“Nobody knows for sure, because nobody has actually followed this material to failure in a controlled condition,” Preston said. “On the road, there are so many variables: vandalism, knock-downs, etc.”

A test deck at MnROAD.
Researchers look at the test deck at MnROAD. The study panel includes city and county engineers.
Resources

Traffic Sign Life Expectancy study – Technical Summary (PDF, 1 MB, 2 pages); Final Report (PDF, 2 MB, 45 pages)

New guidebook, training to facilitate safer pedestrian crossings

City and county engineers often struggle with how to respond to safety concerns about pedestrian crossings, with no scientific method for evaluating them.

In Long Lake, for example, the police department received numerous complaints about the safety of a particular pedestrian crossing. But when the crossing was videotaped, no one was observed using it.

This example — which was part of a research project funded by the Local Road Research Board — exemplifies the difficulties local governments face when they receive requests for a stop sign or signals at a crossing.

A pedestrian crossing control device.

A new manual and June 5 training workshop being held by the Minnesota Local Technical Assistance Program will provide cities and counties with step-by-step tools for evaluating a pedestrian crossing and identifying whether improvements are warranted.

The soon-to-be released guidebook* recommends when to install marked crosswalks and other enhancements based on the average daily vehicle count, number of pedestrians, number of lanes and average vehicle speed. It guides users how to rate a crossing for pedestrian service, and includes a flow chart to assist in decision-making.

The training is unique because it is based on actual video footage of existing crosswalks and the pedestrians which use them.

No guidance

Although vehicles are legally required to stop for pedestrians crossing at intersections and within marked crosswalks, they don’t always yield the right-of-way. And areas with high traffic volumes may not have adequate gaps for pedestrians to cross safely, leading to risk-taking.

Alan Rindels, a MnDOT research engineer, had previously looked for a methodology to evaluate a crosswalk’s effectiveness, but could not find an appropriate engineering analysis.

“What I kept coming up with were results based on the experience of an engineer or planner for what they ‘felt’ was a better crosswalk, such as additional pavement markings, lights or maybe a signal system,” he said.

Rindels finally found guidance in a Transportation Research Board webinar two years ago. Based on that, he asked the LRRB to develop a training methodology for Minnesota practitioners.

Uncontrolled pedestrian crossings

Unless specifically marked otherwise, every intersection is a pedestrian crossing, regardless of the existence of crosswalk markings or sidewalks. At mid-block locations, crosswalk markings legally establish the pedestrian crossing. Uncontrolled pedestrian crossings (which the guidebook focuses on) are locations that are not controlled by a stop sign, yield sign or traffic signal.

Defining where to place pedestrian crossing enhancements — including markings, signs and or other devices — depends on many factors, including pedestrian volume, vehicular traffic volume, sight lines and speed.

The LRRB developed a worksheet that engineers can use to evaluate an uncontrolled pedestrian crossing location in a systematic way, in accordance with the 2010 Highway Capacity Manual. Users note the level of lighting, distance from the nearest all-way stop and whether another location might serve the same pedestrian crossing more effectively.

The guidebook’s 11-step evaluation can identify what level of treatment is appropriate, ranging from overhead flashing beacons and traffic calming devices, such as curb bump-outs, to more expensive options like building overpass or underpass.

Hennepin County Senior Transportation Engineer Pete Lemke, who went through pre-training, said the guidebook will help engineers measure the pedestrian experience by “quantifying the delay at non-signalized intersections.”

“It will inform how we respond to concerns — whether that response is ‘the crossing fits the needs of what’s there’ or ‘we need to make changes or enhancements,'” he said.

Further Resources

Putting Research Into Practice: A Guide for Pedestrian Crossing Treatments at Uncontrolled Intersections – Technical Summary (1 MB, 2 pages); Final Report.

Training workshop – June 5 (register here)

* Consultant Bolton & Menks prepared the guidebook with guidance from a 21-member project team that included University of Minnesota researchers and engineers from the city of Eagan, Hennepin County, Carver County, Scott County, MnDOT, the Center for Transportation Studies and the Federal Highway Administration.

Optimizing traffic counters could net big savings for MnDOT

The design of long-lasting roads requires knowing how many cars and commercial trucks travel over them. To collect this data, engineers rely on traffic counters.

But at a cost of $50,000 to $200,000 each, MnDOT must be judicious about where it places its permanent automatic traffic recorders (ATR) and weigh-in-motion (WIM) sites.

In a new MnDOT-funded research project, University of Minnesota researchers are studying how to optimize ATR placement and other collection methods to improve the quality of the data while reducing costs.

ATRs and WIMs are devices embedded in the pavement surface that continuously collect traffic data.  The state has 91 ATR/WIM sites, as well as 32,500-plus short-duration (i.e. “short-count”) sites where traffic data is collected for 48-hour periods and then used to estimate average daily traffic counts.

“We place permanent traffic counters at key locations across the state and try to logically apply patterns from them to similar locations across the state,” explained MnDOT Project Advisor Alan Rindels. “Short-count locations draw on seasonal patterns from individual or clusters of ATRs to convert 48-hour counts into annual average daily traffic estimates.”

Traffic analysis

The information collected is used by MnDOT’s Traffic Monitoring Unit to analyze traffic patterns and travel trends. An increase in traffic may cause the department to consider increasing the number of lanes or add a traffic light to an intersection that becomes busier. The data is also submitted to the federal government to determine highway funding.

Fifteen WIM sites also collect axle loadings, vehicle and axle configuration and truck volume characteristics. This information is useful for pavement and bridge design, as well as size and weight enforcement.

It’s too early to say what the ultimate outcome of the study will be, but University of Minnesota researcher Diwakar Gupta believes it may involve reducing the number of permanent count locations, while increasing the frequency of counts at short-count locations — which are deployed only once or twice every two, four, six or 12 years. He said research is showing that these snapshots in time may be insufficient for short-duration locations with seasonal commercial truck traffic.

Another option may be retaining all the permanent ATRs, but only collecting data from them every few years. This could reduce site maintenance costs and the manpower needed to analyze continuous traffic count data.

Researchers are also looking at how to better match short-count sites with individual or groups of continuous count locations to improve the accuracy of seasonal adjustments that are used to create annual estimates.

“We think, in the end, Traffic Data Management will transition to a different way of sampling and collecting data,” Gupta said.

A Weigh-In-Motion traffic counter on Highway 52 in South St. Paul.
A Weigh-In-Motion traffic counter on Highway 52, between the Lafayette Bridge and I-494.

Emergency alternate route selected in I-35 pilot project

When a semi carrying millions of bees crashed three years ago on Interstate 35,  a five-mile stretch of freeway near Lakeville  had to be shut down, and it took several hours to re-open.

A new pilot project under way in southern Minnesota would move traffic more quickly during accidents like these by having a predetermined route along I-35 to redirect motorists.

Currently, when the Minnesota State Patrol decides to close a freeway, motorists are left to their own devices to determine where to go.

A sign similar to this will go up along the I-35 alternate route to guide redirected traffic.

“The use of emergency alternate routes are very helpful in rural areas where other roadway options might be limited,” said project consultant Andy Mielke of SRF Consulting, who helped the state of Wisconsin establish similar routes along its interstate.

The MnDOT-funded research project establishes a permanent alternate route parallel to the interstate in Freeborn, Steele and Rice Counties.

MnDOT worked with local officials to identify the best alternative roads and is in the process of procuring signs to permanently affix along the I-35 alternate route this summer.

Picking a route

Identifying an emergency route wasn’t easy. Engineers had to consider the proximity to the freeway, whether a route was direct enough and whether the roads could handle heavy truck traffic.

A planning committee that included MnDOT, the State Patrol and three county engineers developed a route and procedures for everyone to follow.

“All of the responders know where the traffic is going, so they’re all operating off the same sheet of music,” Mielke said.

The alternate route system is intended to reduce traffic delays, minimize secondary crashes, speed the emergency response and keep truck freight moving during a large accident.

More than 5,000 trucks per day travel Interstate 35.

I-35EmergencyAlternateRouteMap
Proposed alternate route.

“If you’re a truck driver sitting in congestion, time is money,” Mielke said.

The planning team identified messages that can be automatically deployed on message boards along 35 during an emergency. The route will only be activated if the freeway is fully blocked or once all other methods of moving traffic are exhausted.

The interest for the project came from MnDOT District 6 Traffic Engineer Mike Schweyen, who participated in Wisconsin’s planning for an emergency alternate route in the La Crosse area.

An I-35 Corridor Emergency Alternate Route Operations Guide has been created. The route plans just need final approval now from the county boards.

This project could be an example for the rest of the state to follow. Other MnDOT districts are considering establishing alternate freeway routes in their districts.

Related Resources

Alternate route plans for Freeborn County, Steele County and Rice County (PDFs) (subject to final county board approval).

MnDOT Develops Best Practices Guide for Culvert Repair (Updated, with Video)

County engineers and MnDOT hydraulics engineers have to wear many hats. One of them is maintaining culverts — the channels beneath roadways that facilitate passage of water and wildlife.

But culvert maintenance is practically a field of knowledge unto itself. To help engineers identify and apply the best repair techniques for specific problems, MnDOT recently produced a best practices guide for culvert repair (links below).

“We wanted to develop a state-of-the practice and put it into one place so engineers could easily find the information they need,” said Lisa Sayler, MnDOT Assistant State Hydraulic Engineer.

It might not always be the most visible or exciting issue from the public’s perspective — although, as the video above illustrates, occasionally it can be very visible — but culvert repair is a critical issue for transportation professionals. In fact, MnDOT submitted the repair guidebook as one of its choices for the AASHTO-RAC’s 2014 high-value research publication.

“There are many different fixes and products available for failing or deteriorating  pipes,” explained District 4 Hydraulics Engineer Jane Butzer, who requested the guidebook. “This guide steps through the different products and practices, and further assists the hydraulics engineer by providing special provisions and standard detail drawings to include in project plans.”

Culvert repair practices have evolved significantly in recent years, so it can be difficult for individual engineers to keep abreast of new practices that come from a wide variety of sources. The guidebook draws from a wide range of sources, including the Federal Highway Administration, the National Cooperative Highway Research Program, AASHTO and numerous state DOTs.

“We synthesized previous work and expanded it from there to provide more details and more quantitative guidance for some specific repairs. We tried to provide more specific design procedures than what we found in previous documents,” said project manager Bruce Wagener of CNA Consulting Engineers.

In addition to providing detailed explanations of rehabilitation and repair methods, the guide includes a table that compares most methods of repair.

Researchers will next conduct a brief feasibility study to identify which culvert repair methods can be observed and tested to document the cost, longevity and effectiveness of repairs.

Sliplining, a common culvert rehabilitation method, involves inserting a fiberglass pipe liner (shown) or other material into a deteriorated culvert.
Resources

Software Tool Cuts Time to Analyze Twin Cities Congestion

Newly developed software has drastically reduced the amount of time and effort required by MnDOT’s Regional Transportation Management Center (RTMC) to analyze congestion in the Twin Cities metropolitan area.

Developing MnDOT’s annual Metropolitan Freeway System Congestion Report used to be a manual process that could be applied to only a portion of the large quantity of data generated by in-pavement sensors.

The new Highway Automated Reporting Tool now automatically imports and cleans data to produce a report about the percentage of network miles congested during peak periods as well as three new reports on other performance measures.

The tool will help MnDOT engineers and planners better develop congestion reduction strategies and determine the most cost-effective investments in the network.

From RTMC’s control room, engineers monitor and manage 400 miles of Twin Cities freeway traffic using data from thousands of in-pavement sensors.

“Before HART, it took months to analyze freeway performance using traffic data from only the month of October. Now engineers can quickly analyze data from any time period, significantly improving traffic planning,” said Jesse Larson, Assistant Freeway Operations Engineer for MnDOT’s Metro District Regional Transportation Management Center.

The tool was developed in a MnDOT-funded study led by University of Minnesota researcher John Hourdos.

Note: This article was adapted from the May–June 2014 issue of our Accelerator newsletter. Sign up for your free print or email subscription by clicking here.

Resources

MnDOT looks for solution to noisy highway rumble strips

Rumble strips alert sleepy and inattentive motorists that they are about to veer off the highway or into the opposite lane of traffic. But the grating noise that prevents collisions can also be annoying to nearby residents.

Around Minnesota, more and more counties are facing push-back as they install shoulder rumble strips on roadways in populated areas. This is because county road shoulders are narrow — leading drivers to frequently hit the rumbles.

“There is a strong concern statewide that these noise complaints will raise enough concern that legislation may be passed reducing their use,” said technical liaison Ken Johnson of MnDOT’s Office of Traffic, Safety and Technology.

A European-developed style of rumble strip, called sinusoidal, could provide Minnesota a new means of warning drivers without as much stray highway noise.

Accident reduction

Rumble strips are patterns ground into asphalt that cause a vehicle to vibrate when its tires come close to the centerline or road edge. They help prevent lane departure crashes, which account for more than 50-percent of fatalities on the road system.

The sinusoidal rumble (below) has a sine wave pattern ground into the pavement, while the traditional rumble strip (top photo) doesn’t follow a wave pattern.

Photo courtesy of the Wirtgen Group
Creation of a Sinusoidal rumble strip. Photo courtesy of the Wirtgen Group

MnDOT’s Office of Traffic, Safety and Technology plans to test different designs of the Sinusoidal rumble strips to find the one with the highest level of interior vehicle noise and lowest level of exterior vehicle noise.

The navigability of sinusoidal rumbles by motorcycles and bicycles will also be evaluated. The project was recently funded with a research implementation grant from MnDOT’s Transportation Research Innovation Group.

If sinusoidal rumble strips are found to be effective, the chosen design will be used for centerlines and road shoulders in noise-sensitive areas throughout the state highway system. It is anticipated that counties will also adopt the design.

Unlike counties, most of MnDOT’s recent complaints have been for its centerline rumbles, which are required on all rural, high-speed undivided roads in Minnesota, Johnson said.

MnDOT has considered allowing more exceptions due to residential noise concern; however, doing so could result in more fatal and serious crashes. Sinusoidal rumbles are seen as a possible alternative for these noise-sensitive areas.

The Local Road Research Board is also studying different designs of sinusoidal rumble strips in Polk County.

New Video: “Why Aren’t They Working on My Road?”

A new video produced by the Local Road Research Board helps the public understand why some bad roads aren’t always fixed first.

The seven-minute video explains what causes road pavements to deteriorate and why, like the saying, “throwing good money after bad,”  it may be more cost-effective to put maintenance dollars into roads that still have life left in them versus roads that are in the worst condition.

In it, city and county engineers discuss how they use a pavement management program to decide which roads to fix when, in order to stretch limited resources in the most effective way possible.

“We’ve learned that if we wait for things to break and fall apart, they’re much more costly to replace than if we put a little bit into it during its life cycle,” says Mark Maloney, City of Shoreview public works director.

New monitoring system gives advance warning of bridge distress

While not inherently unsafe, MnDOT’s fracture-critical bridges — those having critical, nonredundant components — must be inspected on a regular basis. To help track the health of these bridges, MnDOT has developed a bridge health monitoring system that uses electronic instrumentation to provide advance warning of structural distress.

The system detects acoustic emissions — stress waves caused when cracks form and propagate in the steel components of a bridge. Researchers recently deployed and tested the system on the Cedar Avenue/Highway 77 Bridge in Burnsville, enabling them to develop procedures for automatically collecting and processing data.

“Ever since the collapse of the I-35W bridge in Minnesota, many states have been interested in developing a bridge health monitoring system that will help engineers address the many challenges of managing infrastructure and ensure the longevity and safety of our bridges,” said Moises Dimaculangan, MnDOT bridge rating engineer.

To help distinguish real monitoring events from false alarms, researchers conducted tests to capture  acoustic emission data caused by brittle fractures in steel beams using the same bridge health  monitoring system currently being used at the Cedar Avenue Bridge.
To help distinguish real monitoring events from false alarms, researchers conducted tests to capture acoustic emission data caused by brittle fractures in steel beams using the same bridge health monitoring system currently being used at the Cedar Avenue Bridge.

MnDOT will continue to use the system to monitor the Cedar Avenue Bridge, a steel tier-arched bridge over the Minnesota River. It was chosen because it is fracture-critical, but has no history of cracking. The test deployment also led to guidelines for monitoring other fracture-critical bridges.

University of Minnesota researchers recommend further investigation into acoustic emission data analysis methods, as well as using the system developed in this project to monitor another steel bridge, one with a history of cracking.

*Note: This article was adapted from the upcoming May–June 2014 issue of our Accelerator newsletter. Sign up today to receive your free print edition or to receive email notification when new issues become available online. Subscribe here.

Resources

Acoustic Emmission Monitoring of Fracture-Critical Steel Bridges – Technical Summary (PDF, 1 MB, 2 pages); Final Report (PDF, 5 MB, 236 pages)

GPS-equipped mowers to save money, reduce noxious weeds

Putting GPS units on MnDOT highway mowers is expected to speed mowing operations and cut herbicide usage by 50-percent in metro area ditches, reducing groundwater contamination.

MnDOT’s Metro District highway maintenance division will be one of the first — if not the first — state agencies in the country to equip the majority of its maintenance tractors with Automated Vehicle Location systems.

Not only will crews be able to effortlessly track their progress — reducing paperwork and freeing time for other maintenance activities — but the AVL’s live mapping software will help them avoid noxious weed patches, thereby reducing their spread.

Last year, MnDOT tested the GPS software on five mowers.

“AVL alone enables the tracking of vehicle positions, but when combined with equipment sensors and an on-board monitor with user interface, it becomes a very innovative way to reduce operation costs,” said MnDOT Project Engineer Trisha Stefanski, who applied for funding from MnDOT’s Transportation Research Innovation Group for the pilot project.

Vehicle tracking systems have been shown to reduce chemical usage by crop farmers, improve route efficiencies in truck driving and help cities and counties track snowplows.

The on-screen mapping shows the location of weed patches, so mowers can avoid them, reducing their spread.

MnDOT Metro, which tested five AVL units last year, hopes to equip as much of its remaining fleet as possible.

In the grant application, Stefanski estimated the technology will pay for itself in about a year’s time, largely due to herbicide savings.

Noxious weeds

MnDOT is required by law to manage certain noxious weeds along its highways. Each year, weed inspectors survey one-quarter of metro ditches for weeds, which enables them to concentrate eradication efforts on the worst areas.

Touch-screen maps will contain the noxious weed locations so operators can see weed patches and mow around them.

Herbicide usage is estimated to drop an estimated $100,000 to $150,000 per year. (This estimate was based on the original funding request. Final numbers haven’t been released.)

Operators can use the on-screen map to mark the location of new patches of noxious weeds.

Noxious weeds like Wild Parsnip — which can cause painful skin boils — might even be eradicated, reducing the risk for field crews, such as construction workers and Adopt a Highway volunteers.

Until now, maintenance crews have relied on paper maps to identify weed locations, which is less effective.

“What’s better, looking at a live screen when you’re going down the road and seeing where weeds are coming up, or trying to refer to a piece of paper?” Stefanski said.

Other advantages

The AVL equipment will also allow for automated reporting.

Mower operators can use the on-board AVL monitor to mark the location of guardrail hits, potholes, washed-out culverts, debris and unmarked noxious weeds.

Operators can electronically mark the location of guardrails, debris, potholes and more.

Currently, operators must track their activities using hand-written forms or spreadsheets in the office.

The AVL system will also automatically track their location history, allowing operators to optimize their routes based on how long it took to mow segments in the past.

It will also be easier to answer questions from the public, who want to know the last time a certain ditch was mowed.

“Making everything geographically located adds so much analysis opportunity,” Stefanski said.

MnDOT also has AVL technology on an herbicide applicator to better track where it’s sprayed. Other future potential applications including pothole patching and road sweeping operations, Stefanski said.