

In Minnesota’s metro region, areas of shallow groundwater show increasing evidence of chloride contamination from winter road maintenance operations, particularly deicing. More than a quarter show chloride concentrations at the maximum contaminant level for municipal drinking water. In addition, 123 lakes and rivers show chloride impairment or risk of impairment for aquatic life. Chlorides are now considered the second most important threat, after phosphorus, to Minnesota’s urban waters.
The City of Edina, with funding from the Local Road Research Board, hired the University of Minnesota to analyze chloride accumulation in city snowmelt following winter maintenance operations to learn how to most effectively adjust its deicing strategies to reduce chloride contamination.
Over two winters, researchers collected data from city deicing operations and correlated it with chlorides present in meltwater runoff. A sampler box collected data continuously, and snow pile cores were also analyzed. Snowplow operators then examined the results during workshops, yielding innovative ideas for reducing salt use.
“Edina’s plow crews kept their focus on the environment when they evaluated chloride movement after deicing operations. Then they enthusiastically developed a suite of solutions to reduce salt use, some of which have already been implemented,” said Larry Baker, professor, University of Minnesota Department of Bioproducts and Biosystems Engineering.
Researchers met with Edina Public Works staff to examine the correlated data and explore options to improve salt usage. From these conversations, researchers developed a set of recommendations, a guidebook and spreadsheet tool to help maintenance staff improve deicing operations.
What Was Our Goal?
The goal of the recently published study was to find new ways for local agencies to reduce chloride use by linking salt application data with water quality data from melt events.
Edina used a technique called “adaptive management,” through which actions are constantly modified depending upon their effects, that could be replicated by other agencies to both maintain safe winter roadways and reduce the release of chlorides into the environment.
What Did We Do?
Researchers conducted the study in Edina over two winters. They began by developing a device that could collect data from meltwater (melting caused by roadway deicing operations) as it flowed from the pavement. The device had to withstand extreme temperatures (-20 degrees Fahrenheit) and have no moving parts. Researchers designed a plastic box with graduated perforations for water flow to be mounted in the stormwater catchment basin below the grate. Its instrumentation gathered conductance data indicating chloride levels, water flow and temperature continuously through most of the two winters.
Edina Public Works provided ready access to information about salt usage. Its fully automated fleet of trucks supplied road temperature, times/miles plowed and/or salted, salt application rate, total salt use, fuel consumption and labor cost for approximately 20 deicing events. For each weather event, researchers also had meteorological data; the sampler device’s meltwater data; road condition; and cost per event (salt, labor and fuel).
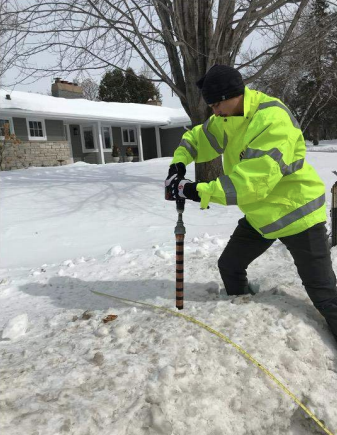
In addition to the sampler’s meltwater chloride data, researchers collected core samples from plow-off snow piles and analyzed the chloride levels in the samples. They hypothesized that chlorides retained in these piles could be released into groundwater during thaws.
What Did We Find?
As researchers expected, flow rates and chloride concentrations varied considerably throughout the winter. They analyzed data on an event-by-event basis and learned that each winter, most of the chloride loading occurred during short periods of time. During the first winter, half of chloride loading occurred in just 41 hours; in the second winter, half of chloride loading occurred in 31 hours. Nearly all of chloride loading occurred in just 181 hours (7.5 days) in the first winter and 190 hours (7.9 days) in the second winter. Analysis of main melt events indicated that some chloride entering the meltwater may have been stored in the watershed, especially in roadside snow piles, and released through the deicing.
“When operators have the right tools to do their jobs, they can maintain a high level of service and use less salt. Data is another tool that has spurred a lot of creativity and problem-solving among the team,” said Jessica Wilson, water resources coordinator, City of Edina.
Using groundwater chloride scenario models, researchers examined contaminant accumulation in watersheds as meltwater flows moved downward to groundwater. Many modeled scenarios showed chloride concentrations moving well above the maximum allowed contaminant level for drinking water (250 milligrams per liter).
Recommendations
Researchers developed the following set of recommendations, along with a manual and spreadsheet calculator tool for using adaptive management for deicing operations (which complements the LRRB Snow and Ice Control Guidebook).
- Target “winter mix” conditions, with large swings in temperature and often significant mixed precipitation. These seem to be the events that result in largest spikes in Chloride mass in the meltwater.
- Monitor the quality of salt as it is received to avoid high-moisture contents that lead to clumping, which in turn makes it difficult to apply salt evenly.
- Add infrared road temperature sensors to trucks to guide salting. Road temperatures can be much different (by as much as 20 degrees) from air temperatures, so air temperatures are not a reliable guide to melt predictions.
- Use reliable salt application sensors and recording systems to quantify the application rates directly with road location.
- Develop post-event operator workshops to share data, experiences and ideas among operators.
- Consider expanded use of Joma blades, while continuing to compare maintenance costs (compared to conventional blades).
Researchers also identified areas for continued study:
- Conduct a study to analyze meltwater Cl patterns in large stormwater drains in relation to weather conditions and de-icing practice. Several watershed districts now monitor flow and specific conductance continuously and are generally willing to share data after they are quality assured.
- Investigate effectiveness of pre-wetting and anti-icing practices for a wide range of Minnesota conditions and application rates.
- Develop a user-friendly tool to predict pavement melting over the period of 4-8 hours to help street departments plan de-icing application rates during a shift.
- Install low-cost pavement temperature sensors and runoff samplers to better understand the dynamics of melting processes, including the fraction of salt application that is plowed or removed from streets.
- Take advantage of the re-building of the MnROAD research facility to include de-icing studies under controlled conditions.
What’s Next?
Workshops for winter road maintenance staff and conference presentations will make the benefits of this project more widely known and available. Two videos were created to present the toolkit: One video explains the background and field study findings, and the other describes management tools and workshops. Both videos are available at the MnDOT Research & Innovation YouTube channel.
Related Links
- Research project page
- Training Manual: Adaptive Management to Improve Deicing Operations
- Groundwater Steady-State Chloride Estimator (Spreadsheet Tool)
- Urban Planning Tool For CI Balance (Spreadsheet Model)
- Training Video: Part 1: Adaptive Management Strategies to Improve Deicing Operations
- Training Video: Part 2: Adaptive Management Strategies to Improve Deicing Operations
